How Many CTAs Does the Median Mobile Paywall Have?
- By Ali Abouelatta
- n = 874
- Published
- Updated
- 2 min read
- paywall · monetization · mobile · ux-patterns · checkout
Short answer
Across 874 mobile paywalls with extracted CTAs in Lazyweb's corpus, the median paywall shows 2 distinct call-to-action texts (p25=1, p75=3, mean 2.89)source[1]. Most paywalls are lean: 42% show a single CTA and 68% show one or twosource[1]. If you have more than three CTAs on a paywall, you are in the top ~21% and should have a reason for it.
The median mobile paywall shows 2 distinct CTAs; 41.8% show just one (n=874 paywalls, Lazyweb Research, July 2026).
Bar chart · Share
Share — The distribution
One block is about 1.5%
- 1
- 41.8%
- 2
- 25.7%
- 3
- 11.3%
- 4+
- 21.2%
The distribution
From 874 canonical paywalls with extracted CTAs, counting distinct CTA texts per screensource[1]:
| Distinct CTAs | Paywalls | Share |
|---|---|---|
| 1 | 365 | 41.8% |
| 2 | 225 | 25.7% |
| 3 | 99 | 11.3% |
| 4+ | 185 | 21.2% |
Median is 2, p25 is 1, p75 is 3, and the mean is 2.89source[1] — pulled up by a long tail of dense paywalls.
How to apply it
Two CTAs is the modal, safe structure: typically one primary subscribe/continue action plus a secondary link (restore, view plans, or dismiss)source[1]. A single-CTA paywall is the single most common pattern at 41.8%source[1] and is a defensible minimalist choice. Going to 4+ distinct CTAs puts you in the top 21%source[1]; that usually means multiple plan buttons acting as CTAs, so make sure the primary action is still unmistakable.
Caveats
Counts use distinct CTA texts per canonical to avoid double-counting re-extractions; raw row counts have a long tail (up to 114 rows on one canonical)source[2]. CTAs were extracted for 874 of the 1,297 canonical paywallssource[1]. This measures how many CTA texts appear, not their roles — see the role-mix pages for primary/secondary/dismiss splits.
Real in-market screens
Screens from real, in-market apps, tracked by Lazyweb Research.

Superlist1206 × 2622opens the full image 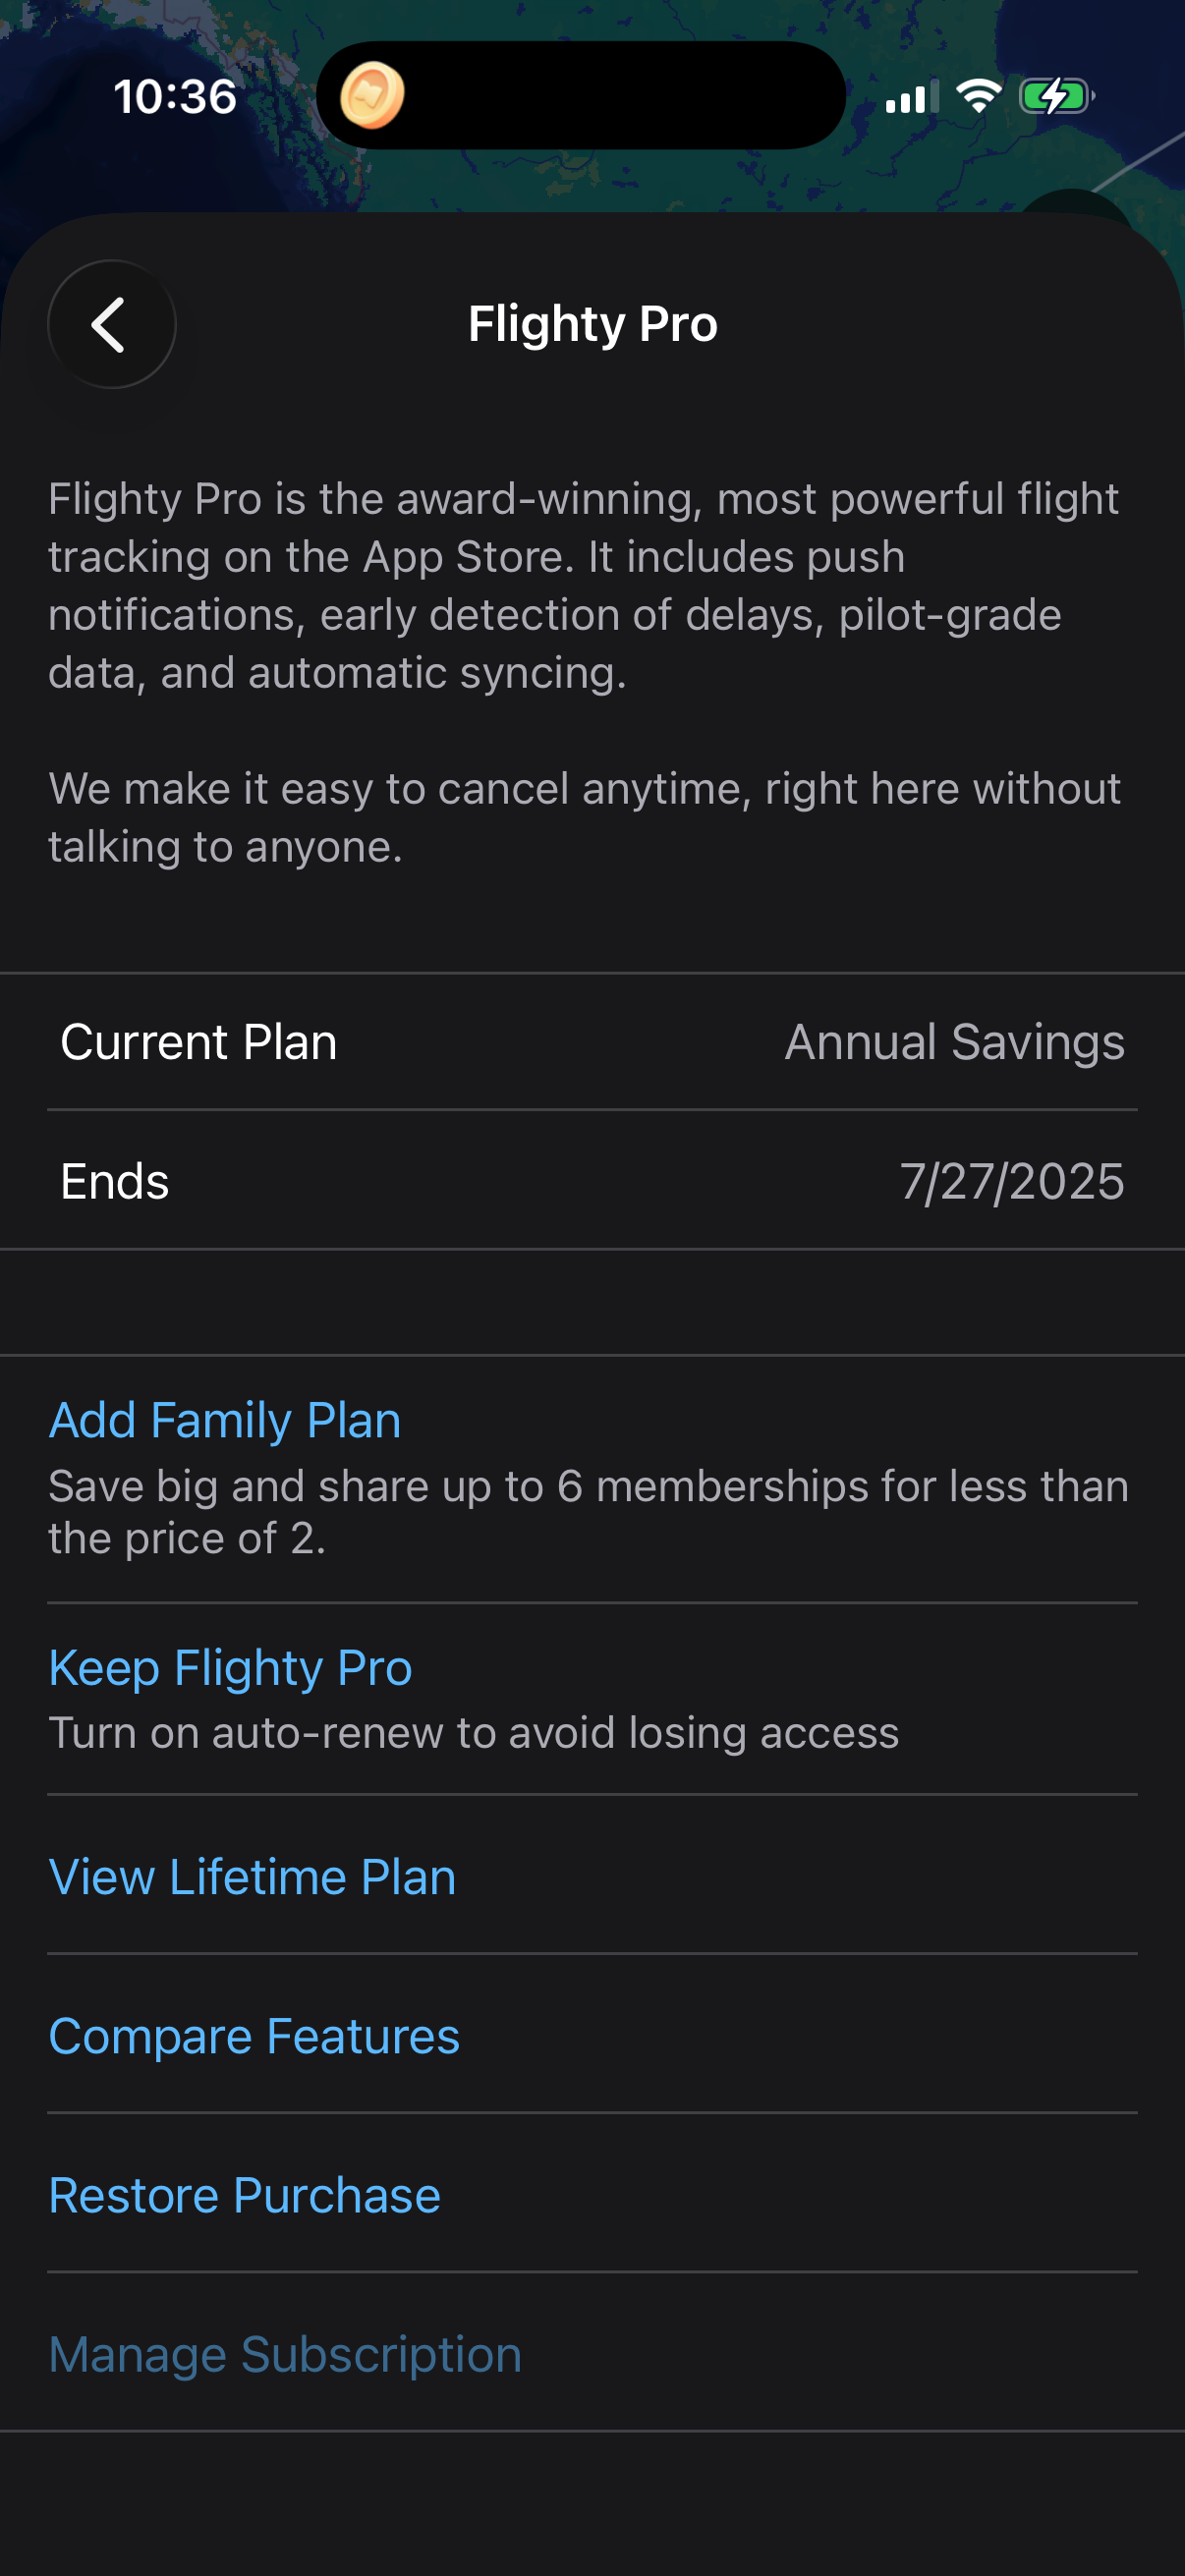
Flighty1206 × 2622opens the full image 
Headway1179 × 2556opens the full image 
Glow1206 × 2622opens the full image
The numbers
| # | Stat | Computed from |
|---|---|---|
| [1] | median 2 CTAs (p25 1, p75 3, mean 2.89); 1=365 (41.8%), 2=225 (25.7%), 3=99 (11.3%), 4+=185 (21.2%) of 874 | cta_count_per_paywall: distinct cta_text per canonical from paywall_ctas |
| [2] | 874 of 1,297 canonical paywalls have extracted CTAs; max 114 raw rows on one canonical | cta_count_per_paywall coverage and dedup note |
Methodology
Universe: 874 canonical paywall screens with extracted CTAs across ~800 tracked apps; distinct CTA texts counted per canonical, July 2026. Caveat: counts distinct texts (not roles); raw rows have a long tail so dedup is required.
Sources
- [1]
Lazyweb Research analysis of 874 paywall screens with extracted CTAs (~800 tracked apps), July 2026
Distinct lower(cta_text) counted per sc_canonical_id from paywall_ctas.
- [2]
Lazyweb Research analysis of 1,297 canonical paywall screens (~800 tracked apps), July 2026
CTA extraction covers 874 canonicals; distinct-text dedup avoids re-extraction inflation.
Source: Lazyweb Research — proprietary analysis of real, in-market app screens. Cite as Lazyweb Research, 2026-07-07.