Are the 'ad' screens in app teardowns really third-party display ads?
- By Ali Abouelatta
- n = 751
- Published
- Updated
- 2 min read
- monetization · ux-patterns · mobile · design · upsell
Short answer
Mostly no. Of 199 ad-category canonical screens (156 'Ad' plus 43 'Ads Privacy'), the 'Ad' bucket is dominated by in-app promotional and coin-offer pop-ups, the app upselling itself, not third-party display inventory source[1]. Real display-ad prevalence is measured separately from tags: 146 of 751 apps (19%) source[2].
The 156-screen 'Ad' category is mostly in-app coin-offer promos; true display-ad prevalence is 146 of 751 apps (19%), July 2026.
The finding: two different things
It is easy to conflate an 'Ad' screen category with 'apps showing display ads', but in this corpus they are different measures source[1]source[2].
| Signal | Count | What it actually is |
|---|---|---|
| 'Ad' + 'Ads Privacy' canonical screens | 199 | Mostly in-app promos/coin offers |
| Apps with a tagged display/banner/interstitial ad | 146 of 751 (19%) | Third-party display inventory |
Webtoon's first-time-only $5.99 coin bundle pop-up ('Grab NOW') is a representative 'Ad'-category screen, and it is an in-app IAP promo, not a third-party ad source[1].
How to apply it (and read teardowns correctly)
When you see an 'ad screen' count in a competitive teardown, ask whether it means the app is running a coin/IAP promo interrupt or serving third-party display ads; they imply very different monetization and UX tradeoffs. Use the tag-derived 146-company figure when you want display-ad prevalence, and treat the 'Ad' screen category as in-app promotional interrupts source[1]source[2].
Caveats
The 199-screen category count comes from 23,407 canonical screens; the 146-app figure is tag-derived, deduped by company, and a lower bound source[1]source[2]. Neither should be quoted against a 62,376-company denominator.
Real in-market screens
Screens from real, in-market apps, tracked by Lazyweb Research.
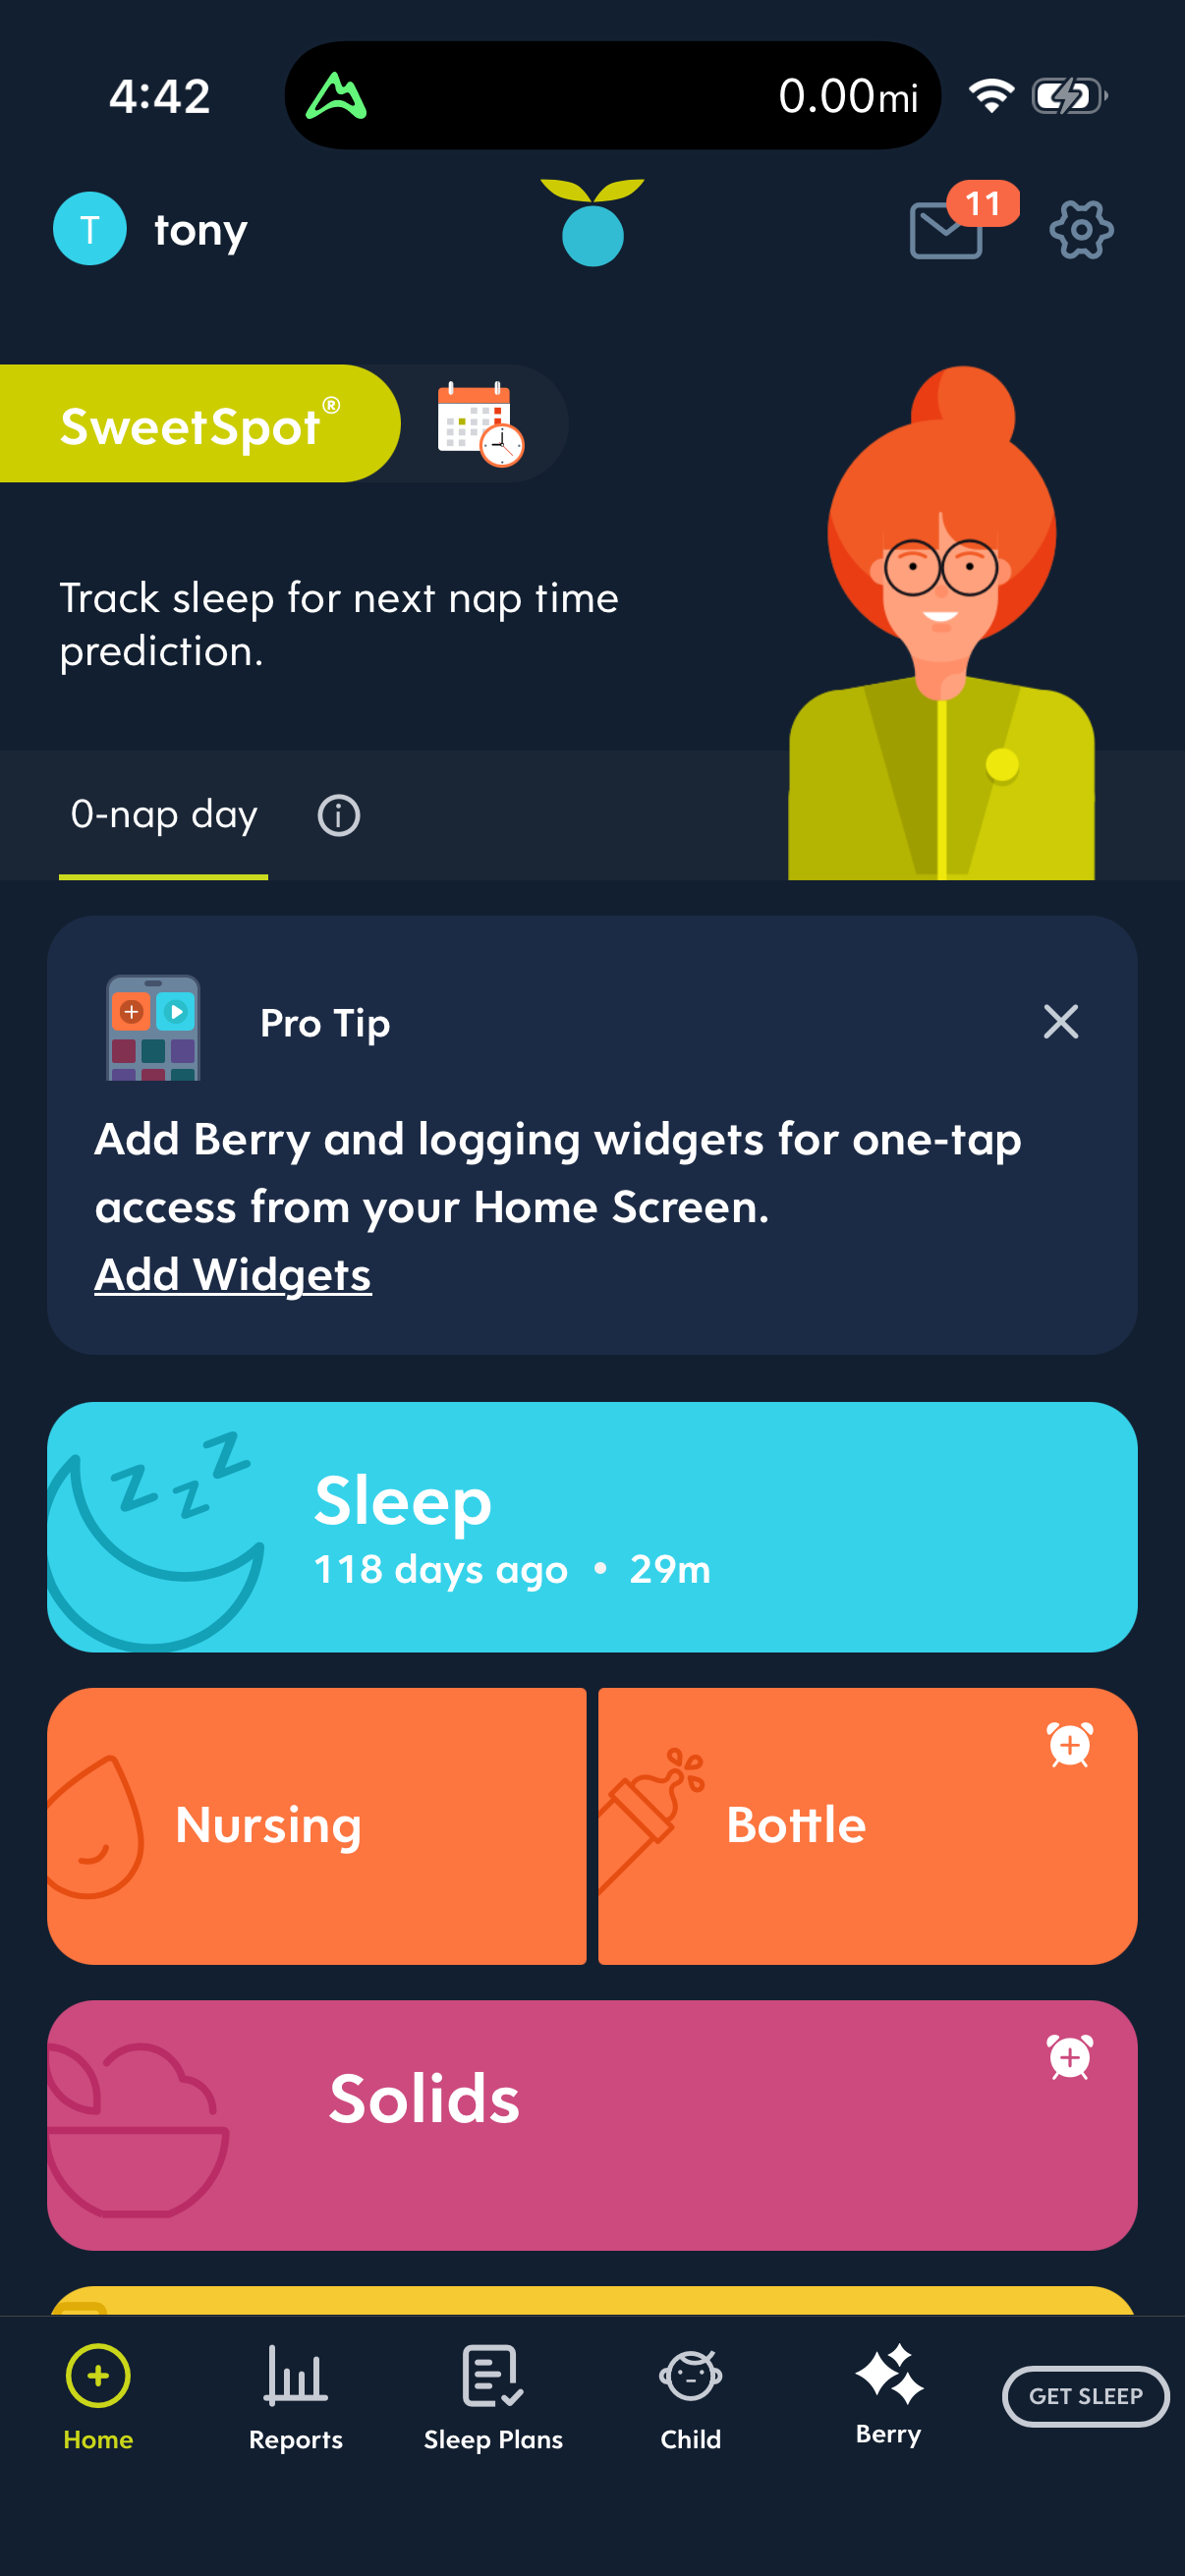
Huckleberry1206 × 2622opens the full image 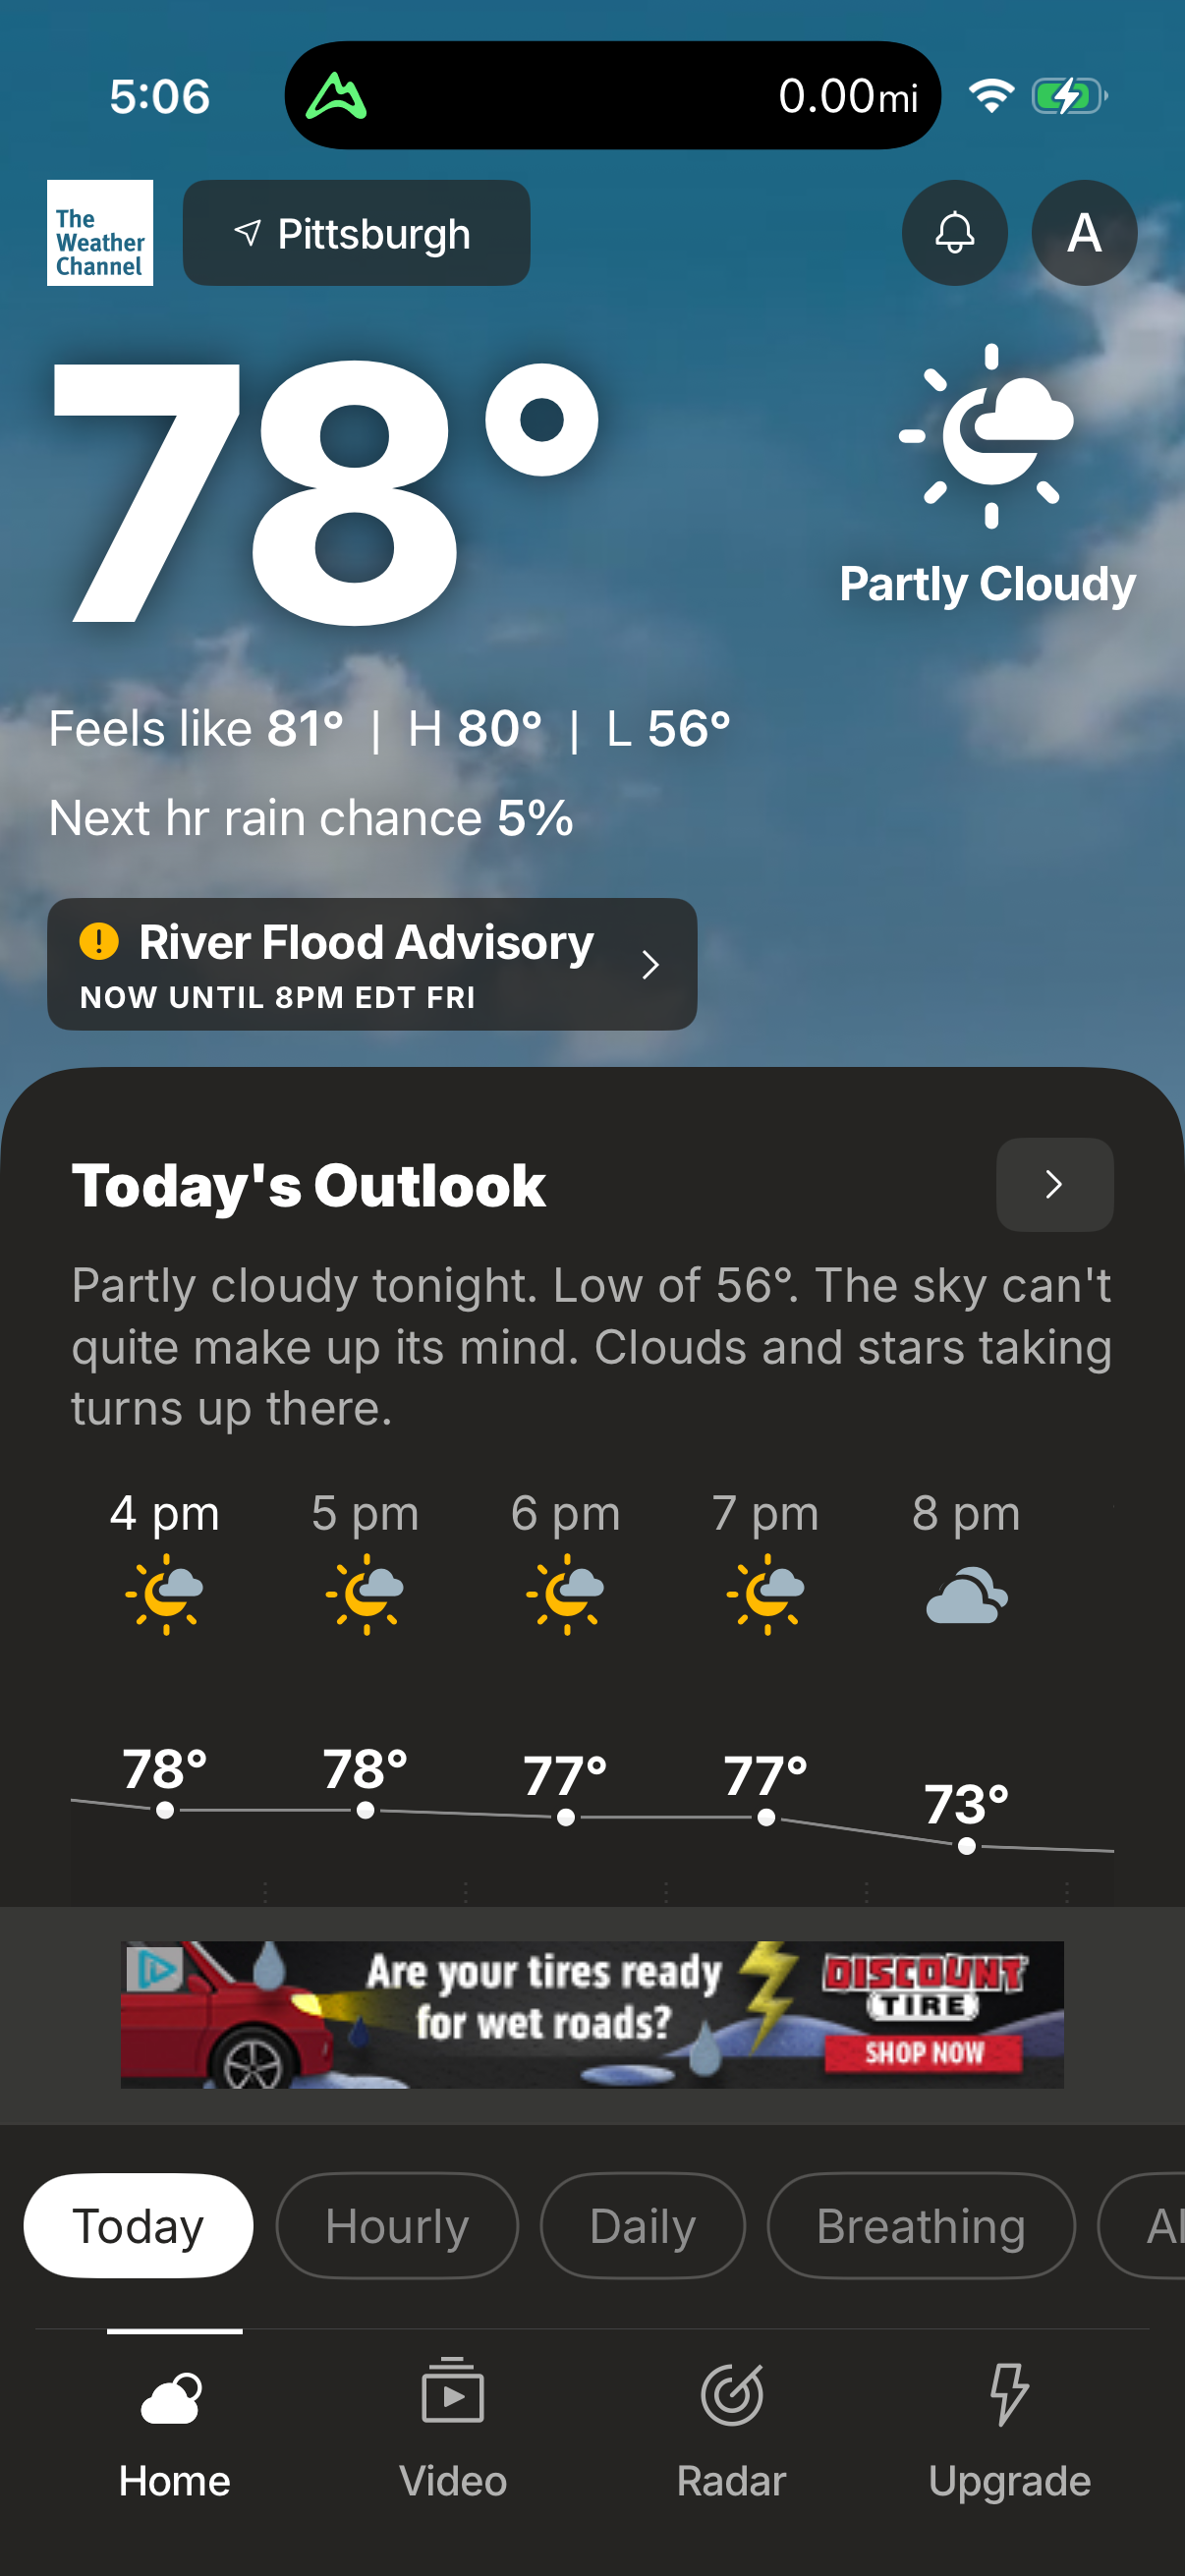
The Weather Channel1206 × 2622opens the full image 
Babbel1206 × 2622opens the full image 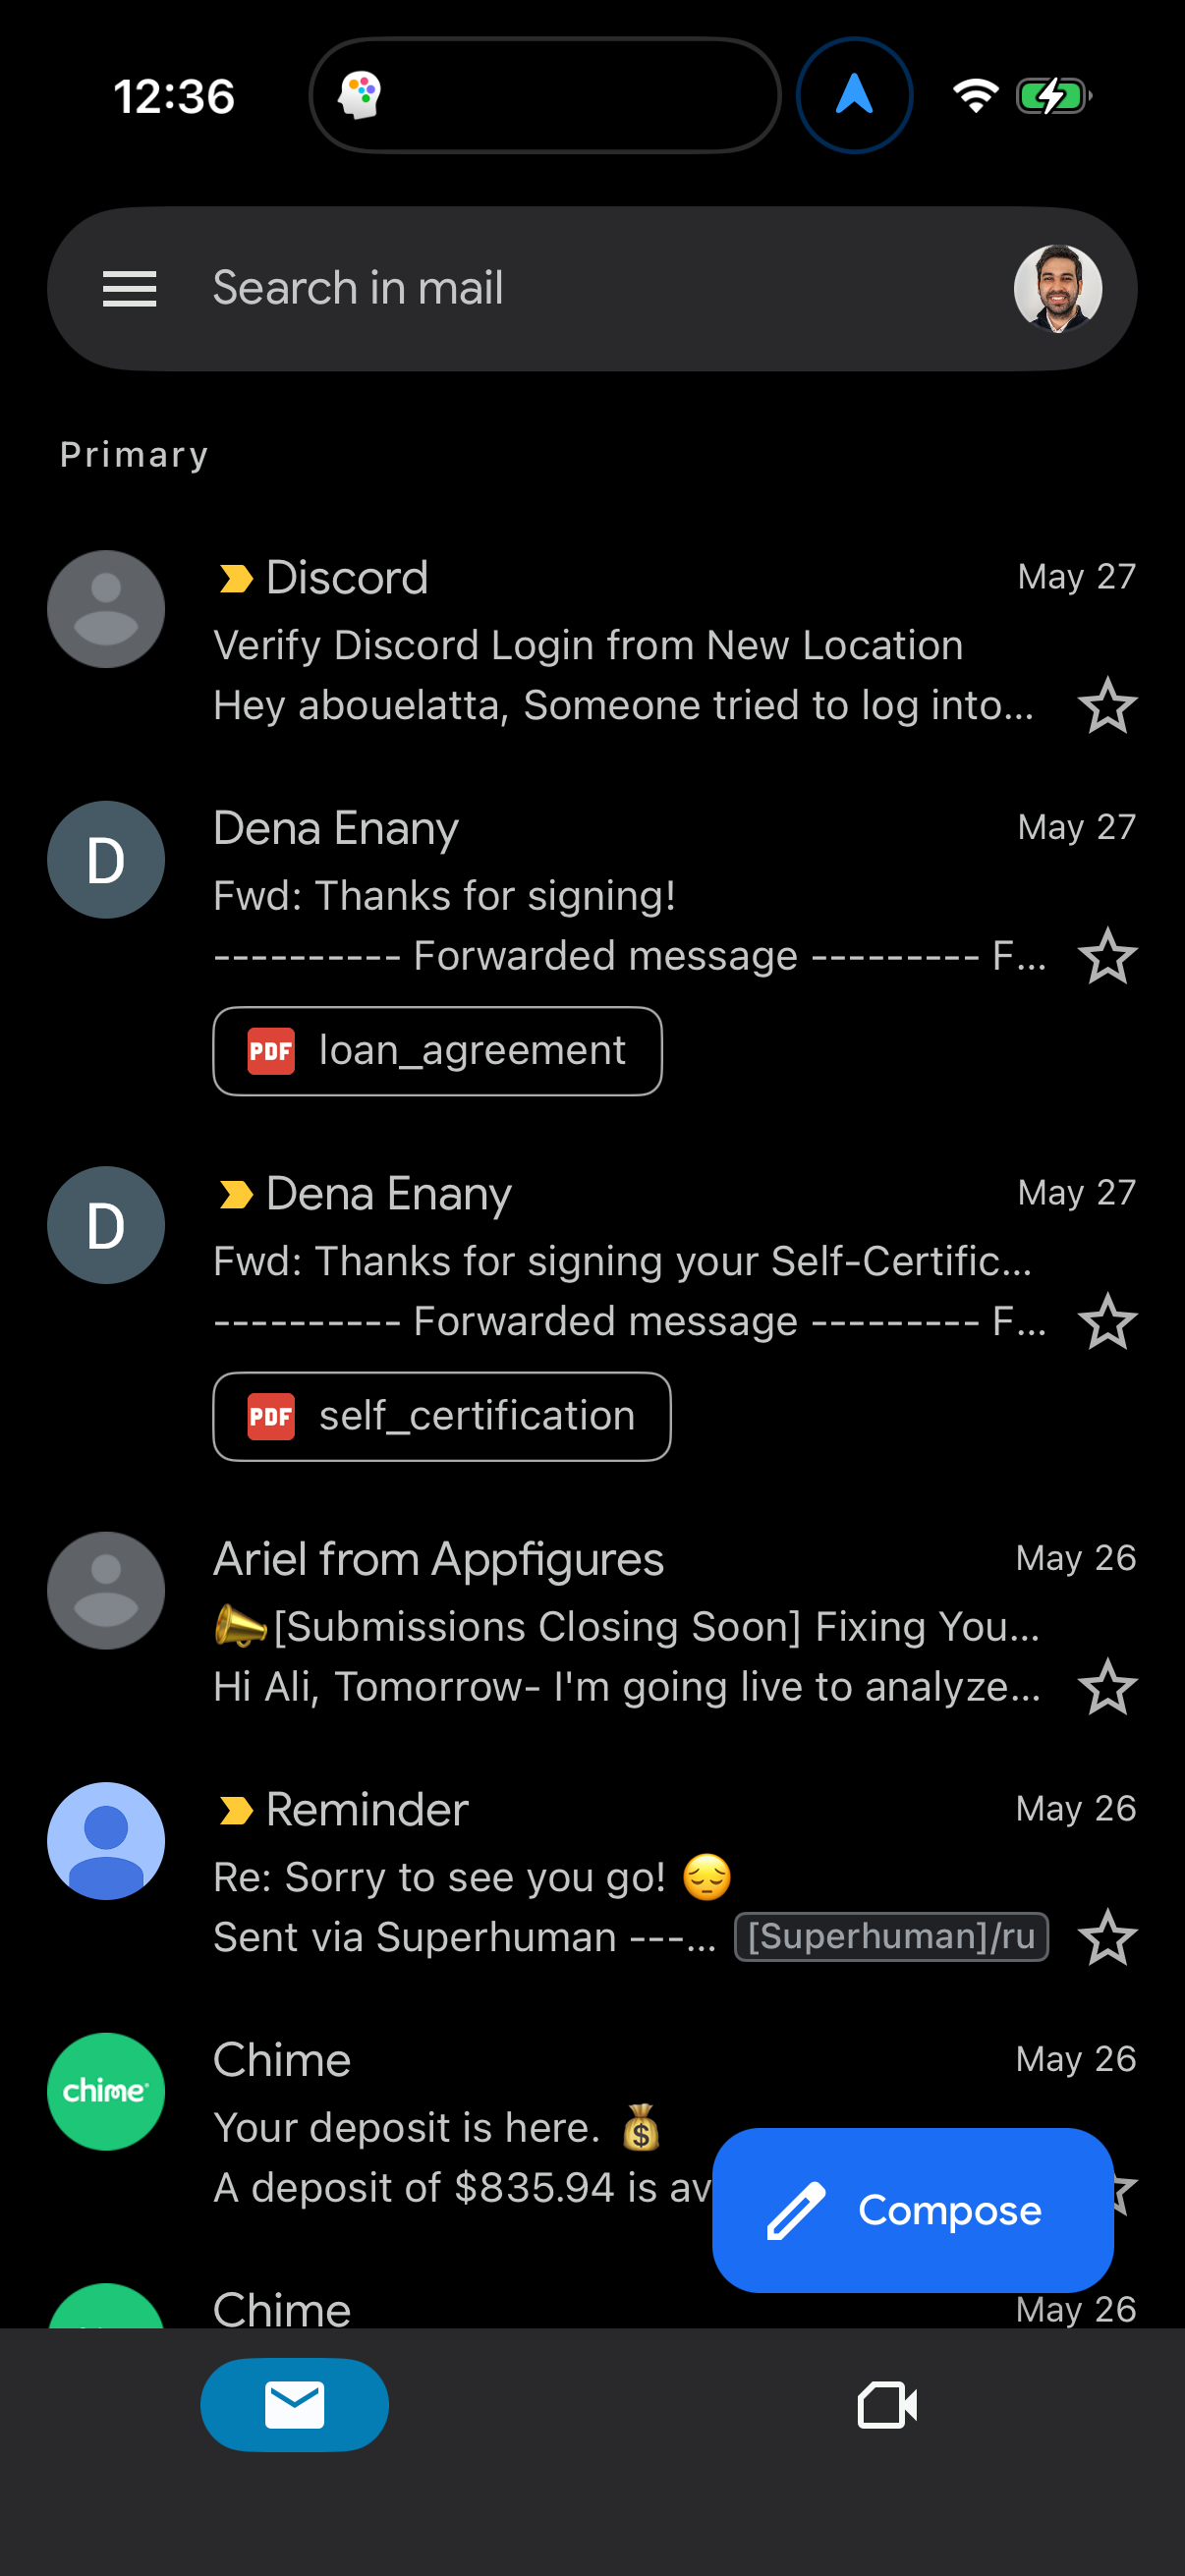
Gmail1206 × 2622opens the full image
The numbers
| # | Stat | Computed from |
|---|---|---|
| [1] | 156 'Ad' + 43 'Ads Privacy' canonical screens (199 total), mostly in-app coin-offer promos | sc_canonical joined to screen_category where category is ad or ads privacy, out of 23,407 canonical screens |
| [2] | 146 of 751 tagged apps (19%) show a display/banner/interstitial ad | distinct companies with a screenshot tagged interstitial/banner ad/display ad/advertisement |
Methodology
Universe: 23,407 canonical screens and 751 tagged apps (~800 tracked). Method: screen-category counts vs tag-derived display prevalence deduped by company, July 2026. Caveat: 'Ad' category is mostly in-app promos; tag figure is a lower bound.
Sources
- [1]
Lazyweb Research analysis of 23,407 canonical screens (~800 tracked apps), July 2026
'Ad' category dominated by in-app promos, e.g. Webtoon $5.99 coin bundle.
- [2]
Lazyweb Research analysis of 751 tagged apps (~800 tracked apps), July 2026
Tag-derived display-ad prevalence, deduped by company; a lower bound.
Source: Lazyweb Research — proprietary analysis of real, in-market app screens. Cite as Lazyweb Research, 2026-07-07.