Which App Categories Lead Their Paywall With a Free Trial vs a Neutral 'Continue'?
- By Ali Abouelatta
- n = 1,162
- Published
- Updated
- 2 min read
- paywall · monetization · mobile · trials · pricing
Short answer
Comparing five verticals with n>=70 primary paywall CTAs (~800 tracked apps), free/trial framing is the plurality in Music (46.1%), Health & Fitness (38.5%) and Education (37.9%), while Graphics & Design instead leads with 'Continue' (continue-led 54.2%, trial just 15.6%) source[1]. Photo & Video sits in between, with continue-led (20.0%) and free/trial (23.9%) running close source[1]. Category, not a universal best practice, drives the choice source[1].
Free/trial CTAs are the plurality in Music (46.1%), Health & Fitness (38.5%) and Education (37.9%) but only 15.6% in Graphics & Design, which leads with 'Continue' at 54.2% — Lazyweb Research, July 2026.
Bar chart · n (apps)
n (apps) — Side-by-side
One block is about 15.8 n (apps)
- Music
- 128 (15)
- Health & Fitness
- 340 (36)
- Education
- 443 (26)
- Photo & Video
- 155 (15)
- Graphics & Design
- 96 (9)
The finding
There is no single cross-category norm — the trial-vs-continue balance flips by vertical source[1]. Music, Health & Fitness and Education all lead with a free-trial promise, while Graphics & Design leads with a neutral 'Continue' and Photo & Video is roughly balanced source[1].
Side-by-side
| Vertical | n (apps) | Free/trial-led | Continue-led | Price-in-button |
|---|---|---|---|---|
| Music | 128 (15) | 46.1% | 7.8% | 2.3% |
| Health & Fitness | 340 (36) | 38.5% | 22.6% | 3.8% |
| Education | 443 (26) | 37.9% | 19.0% | 9.0% |
| Photo & Video | 155 (15) | 23.9% | 20.0% | 10.3% |
| Graphics & Design | 96 (9) | 15.6% | 54.2% | 25.0% |
The cleanest split: subscription-catalog categories (Music) and habit/outcome categories (Health, Education) lean trial-led; creative-tools (Graphics & Design) lean continue-led with visible pricing source[1].
How to apply it
Benchmark against your own category, not the global average. If you're in Music/Health/Education, a trial-led CTA is the convention (and its absence stands out). If you're in creative tools, a neutral 'Continue' with price nearby is the norm and a trial pitch is out of pattern. Photo & Video gives you the most freedom — both approaches are well within its distribution source[1].
Caveats
Company bases vary widely (9-36); Graphics & Design (9 apps) and the two 15-app verticals are thin, so read their percentages as directional source[2]. All five clear the n>=70 CTA threshold for percentage cuts; verticals below 70 (e.g., Weather at 69) are excluded source[2]. 39% of the full corpus is role='unknown' and excluded source[2].
Real in-market screens
Screens from real, in-market apps, tracked by Lazyweb Research.

Splice1179 × 2556opens the full image 
Ai Chatbot1206 × 2622opens the full image 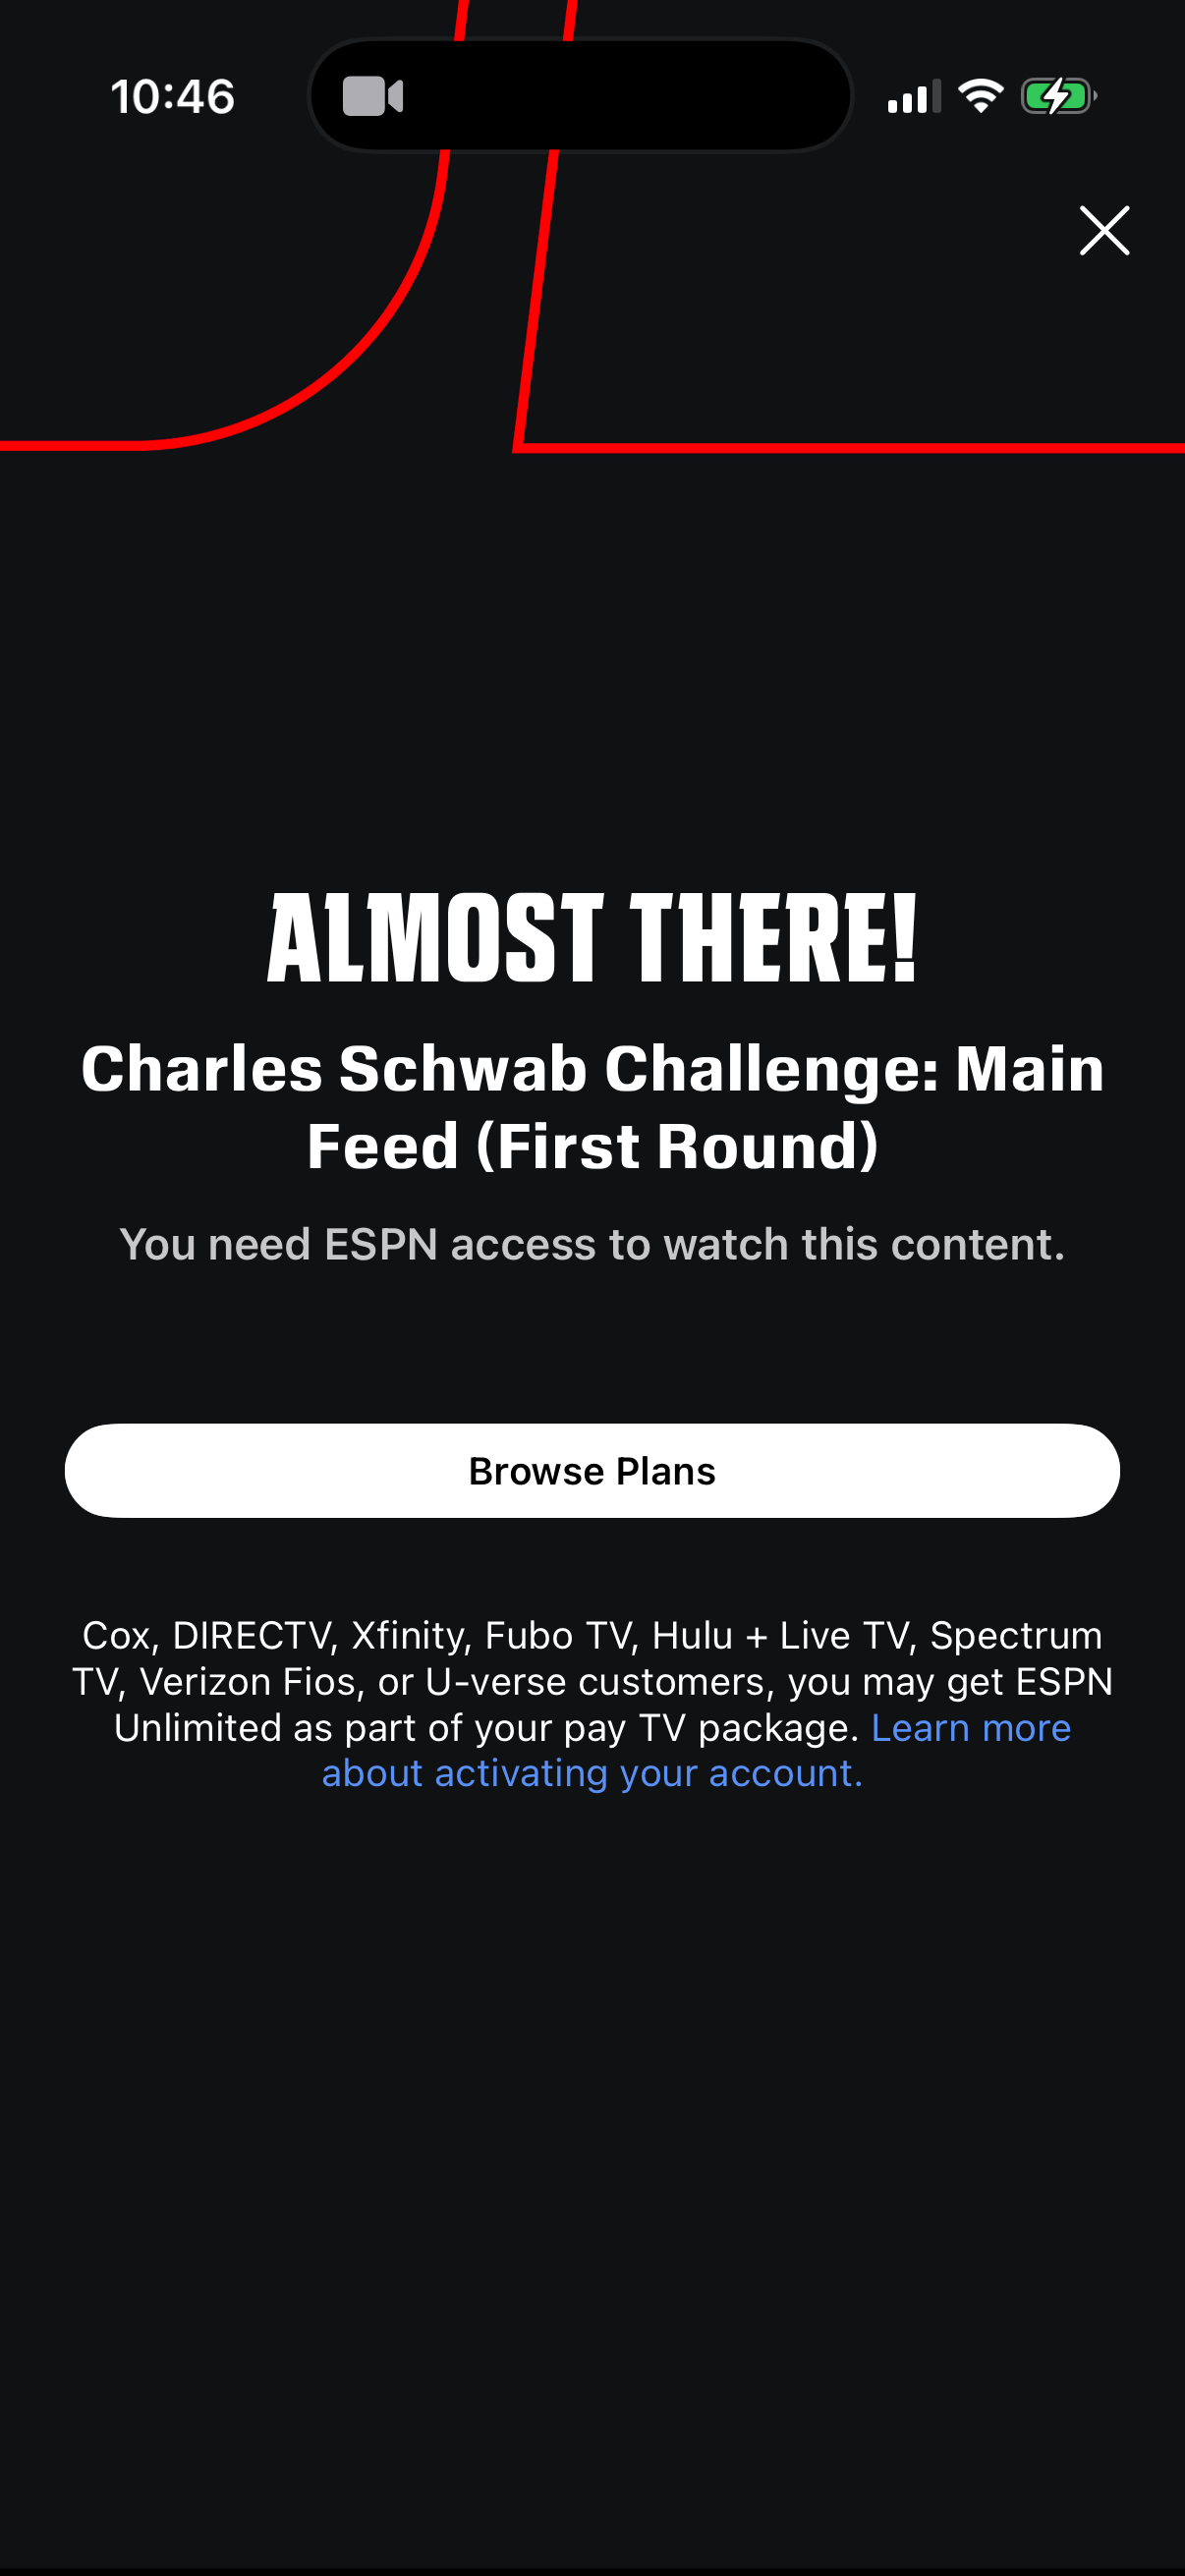
Espn1206 × 2622opens the full image 
Disney1125 × 2436opens the full image
The numbers
| # | Stat | Computed from |
|---|---|---|
| [1] | Music free/trial 46.1% / continue 7.8% / price 2.3%; Health & Fitness 38.5% / 22.6% / 3.8%; Education 37.9% / 19.0% / 9.0%; Photo & Video 23.9% / 20.0% / 10.3%; Graphics & Design 15.6% / 54.2% / 25.0% | music_top_ctas, health_fitness_top_ctas, education_top_ctas, photo_video_top_ctas, graphics_design_top_ctas |
| [2] | app counts: Music 15, Health & Fitness 36, Education 26, Photo & Video 15, Graphics & Design 9; verticals below n=70 CTAs excluded (Weather n=69) | category_primary_cta_totals / smallSampleWarnings |
Methodology
Universe: primary paywall CTAs across five App Store verticals with n>=70 (Music 128, Health & Fitness 340, Education 443, Photo & Video 155, Graphics & Design 96) from ~800 tracked apps, Supabase pull July 2026. Companies joined on lower(company_name); buckets via regex. Caveat: company bases 9-36 — percentages are directional for the thinnest verticals.
Sources
- [1]
Lazyweb Research analysis of 1,162 primary paywall CTAs across five verticals (~800 tracked apps), July 2026
Per-vertical copy-family shares for Music, Health & Fitness, Education, Photo & Video, Graphics & Design.
- [2]
Lazyweb Research analysis of primary paywall CTAs by App Store category (~800 tracked apps), July 2026
Per-vertical CTA totals and distinct-company counts; only n>=70 verticals get percentage cuts.
Source: Lazyweb Research — proprietary analysis of real, in-market app screens. Cite as Lazyweb Research, 2026-07-07.