What Is the Most Common Paywall CTA in Photo & Video Apps?
- By Ali Abouelatta
- n = 155
- Published
- Updated
- 2 min read
- paywall · monetization · mobile · trials · pricing
Short answer
Across 155 primary paywall CTAs from 15 tracked Photo & Video apps, 'continue' is the top single button text (29 instances, 6 companies) source[1]. Photo & Video is more balanced than Education or Health: continue-led (20.0%) and free/trial-led (23.9%) are close, and price-in-button is comparatively high at 10.3% source[2].
In Photo & Video apps, 'continue' leads at 29 of 155 primary CTAs (6 companies), with continue-led (20.0%) and free/trial (23.9%) running close — Lazyweb Research, July 2026.
Bar chart · Share of 155
Share of 155 — Bucket breakdown
One block is about 0.9%
- Free / trial-led
- 23.9%
- Continue-led
- 20.0%
- Price-in-button
- 10.3%
- Urgency (broad, incl. 'now')
- 5.2%
The finding
Photo & Video has 155 primary CTAs from 15 apps source[1]. 'Continue' leads (29 instances, 6 companies), then 'subscribe' (27, but from 1 app — an artifact), 'start free trial' (14, 4 companies) and 'get youtube premium' (12, which is YouTube specifically) source[1]. Only 'continue' and 'start free trial' span multiple companies, so treat 'subscribe' and the branded 'get youtube premium' as app-level rather than category patterns source[1].
Bucket breakdown
| Copy family | CTAs | Share of 155 |
|---|---|---|
| Free / trial-led | 37 | 23.9% |
| Continue-led | 31 | 20.0% |
| Price-in-button | 16 | 10.3% |
| Urgency (broad, incl. 'now') | 8 | 5.2% |
Unlike Education and Health, where trial framing dominates by a wide margin, Photo & Video is more even: continue-led and free/trial are within four points, and price-in-button (10.3%) is notably higher than in the fitness/education verticals source[2].
How to apply it
Photo & Video buyers see a flatter distribution, so there is no single dominant convention to copy. A trial-led CTA (23.9%) or a neutral 'Continue' (20.0%) are both well within norm. The elevated price-in-button share (10.3%) suggests this vertical is more comfortable surfacing price directly — worth testing if your product's value is immediately obvious from the editor preview source[2].
Caveats
155 CTAs from just 15 apps, and two of the top four strings ('subscribe' = 1 app, 'get youtube premium' = YouTube) are single-app — the vertical is thin below rank 1 source[1]. Percentages use the 155 primary CTAs and are published because n>=70; still frame as 'of 155 CTAs from 15 apps' source[2]. 39% of the full corpus is role='unknown' and excluded source[2].
Real in-market screens
Screens from real, in-market apps, tracked by Lazyweb Research.
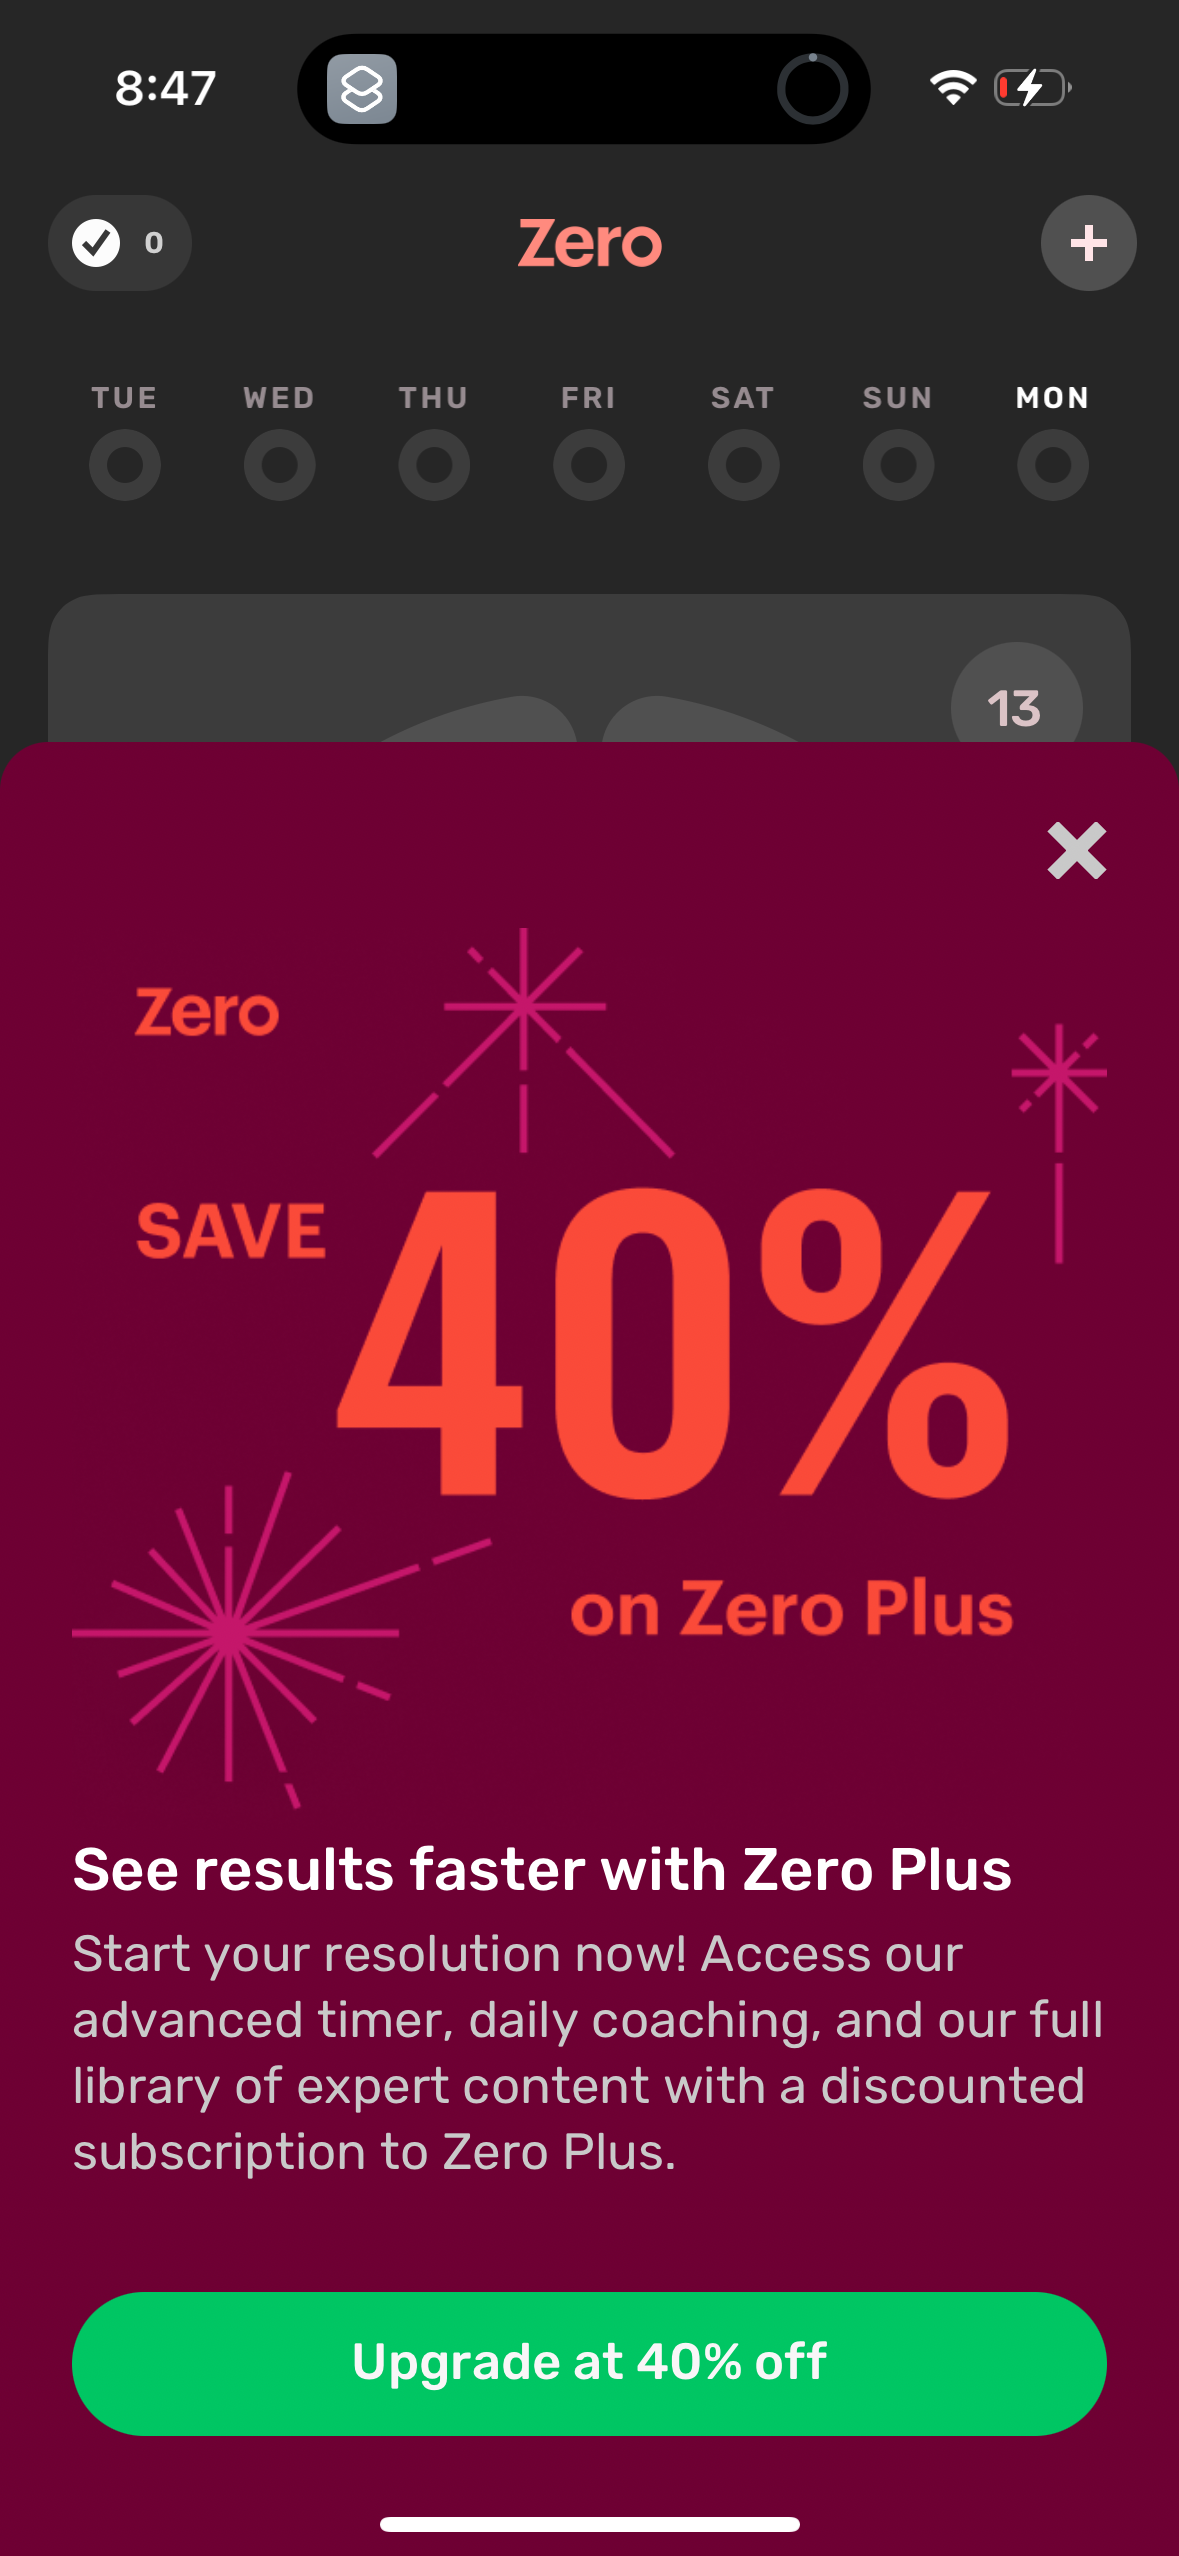
Zero1179 × 2556opens the full image 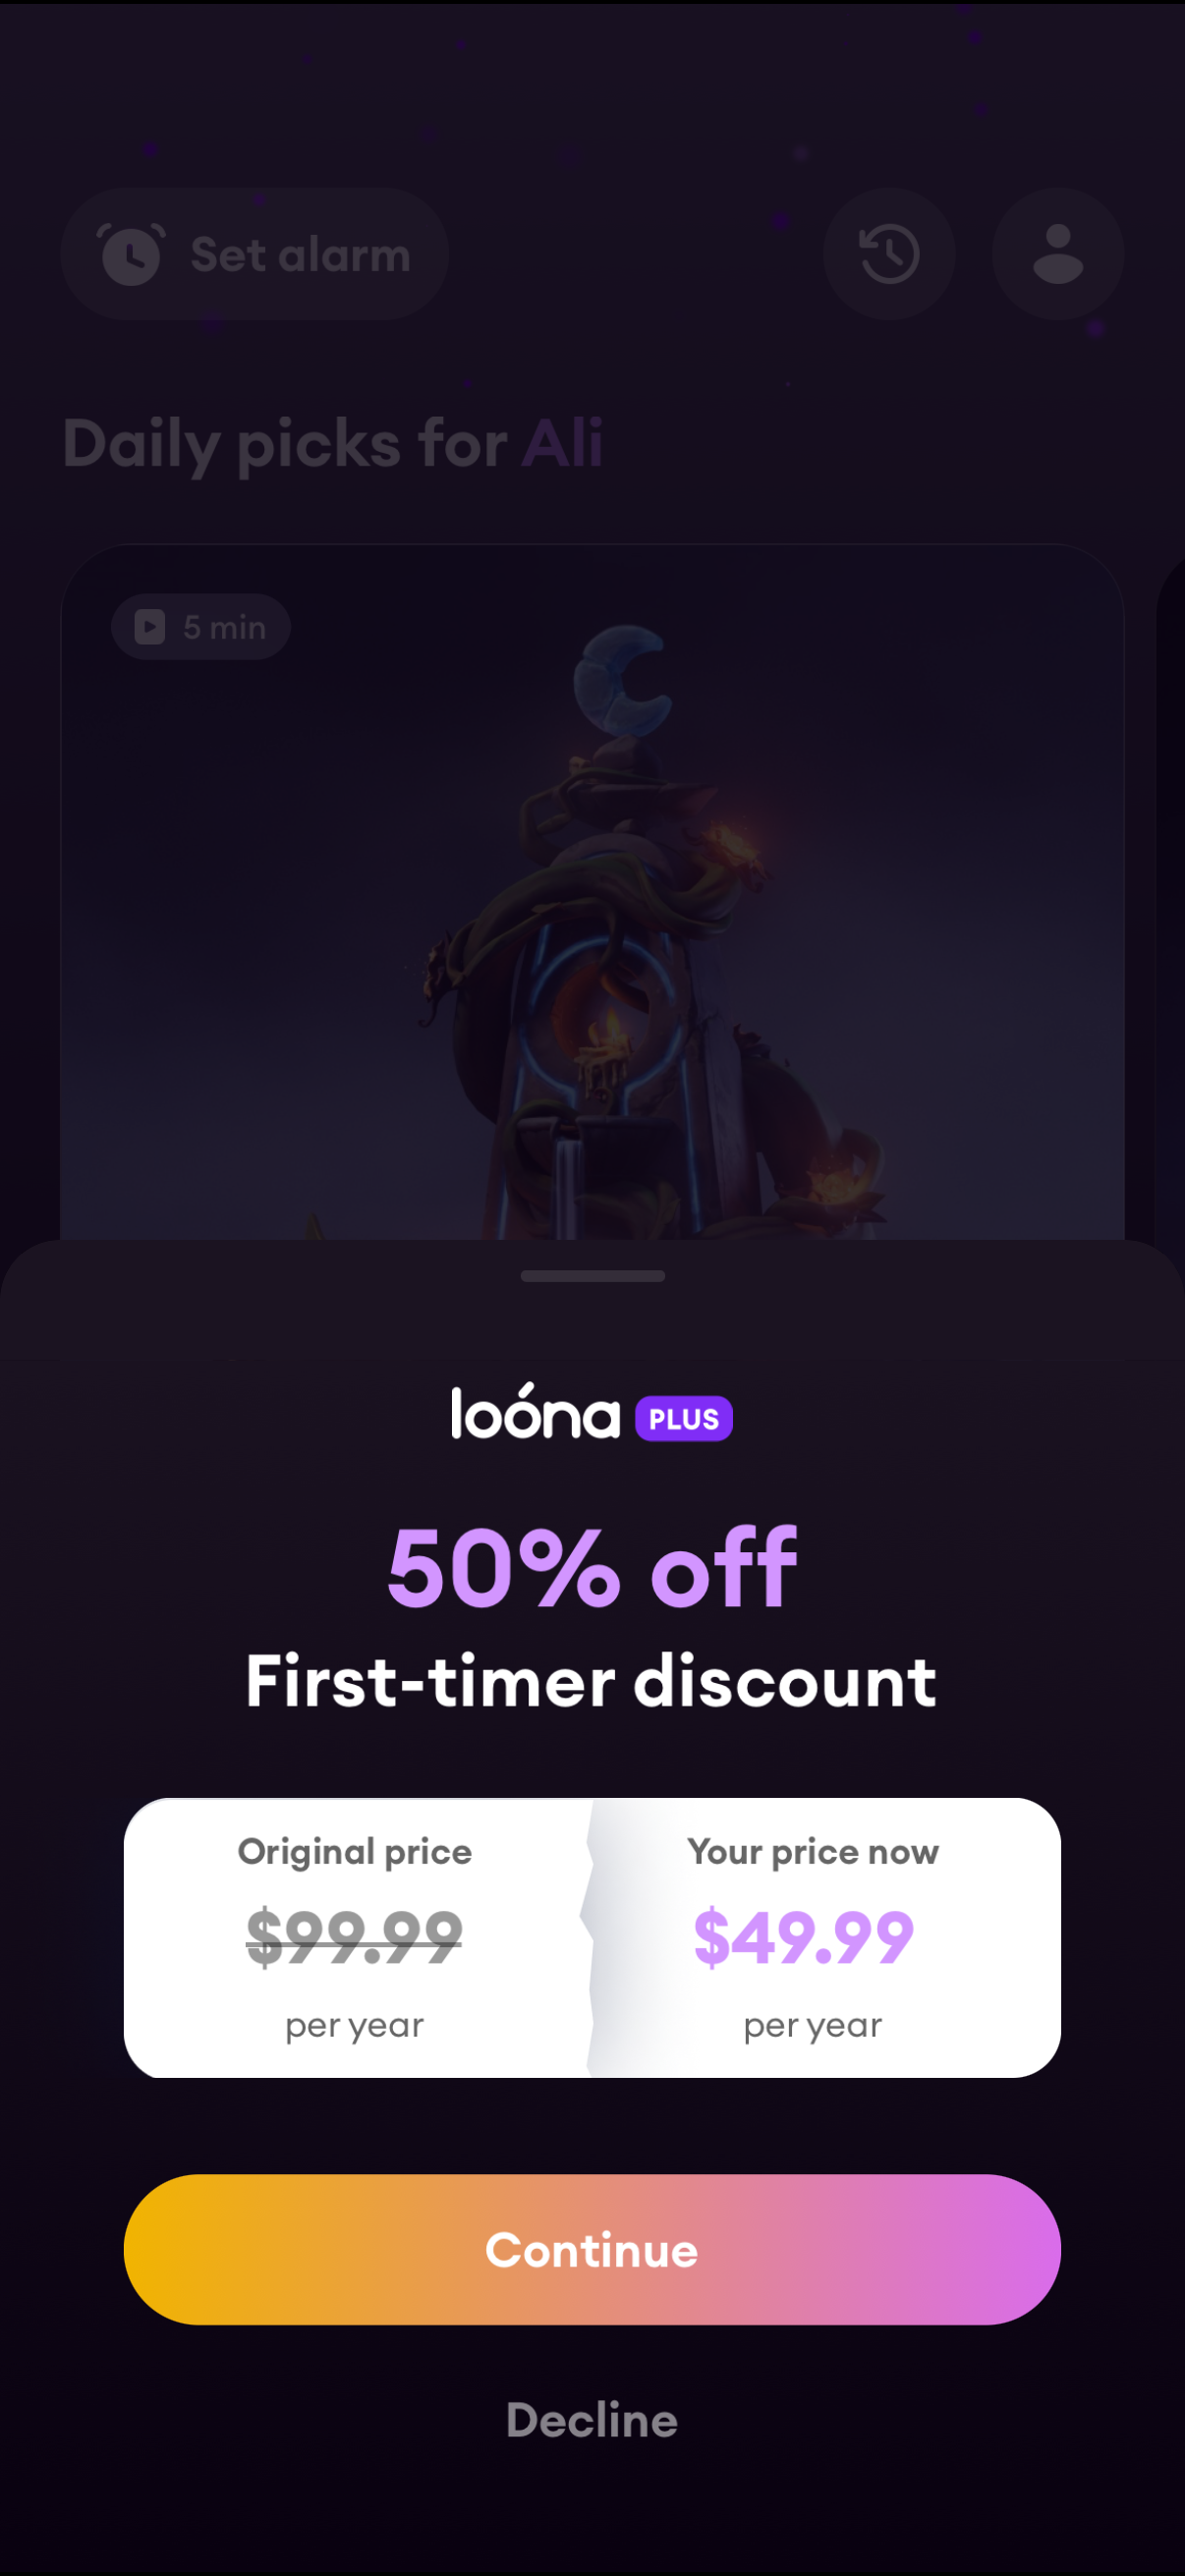
Loona1206 × 2622opens the full image 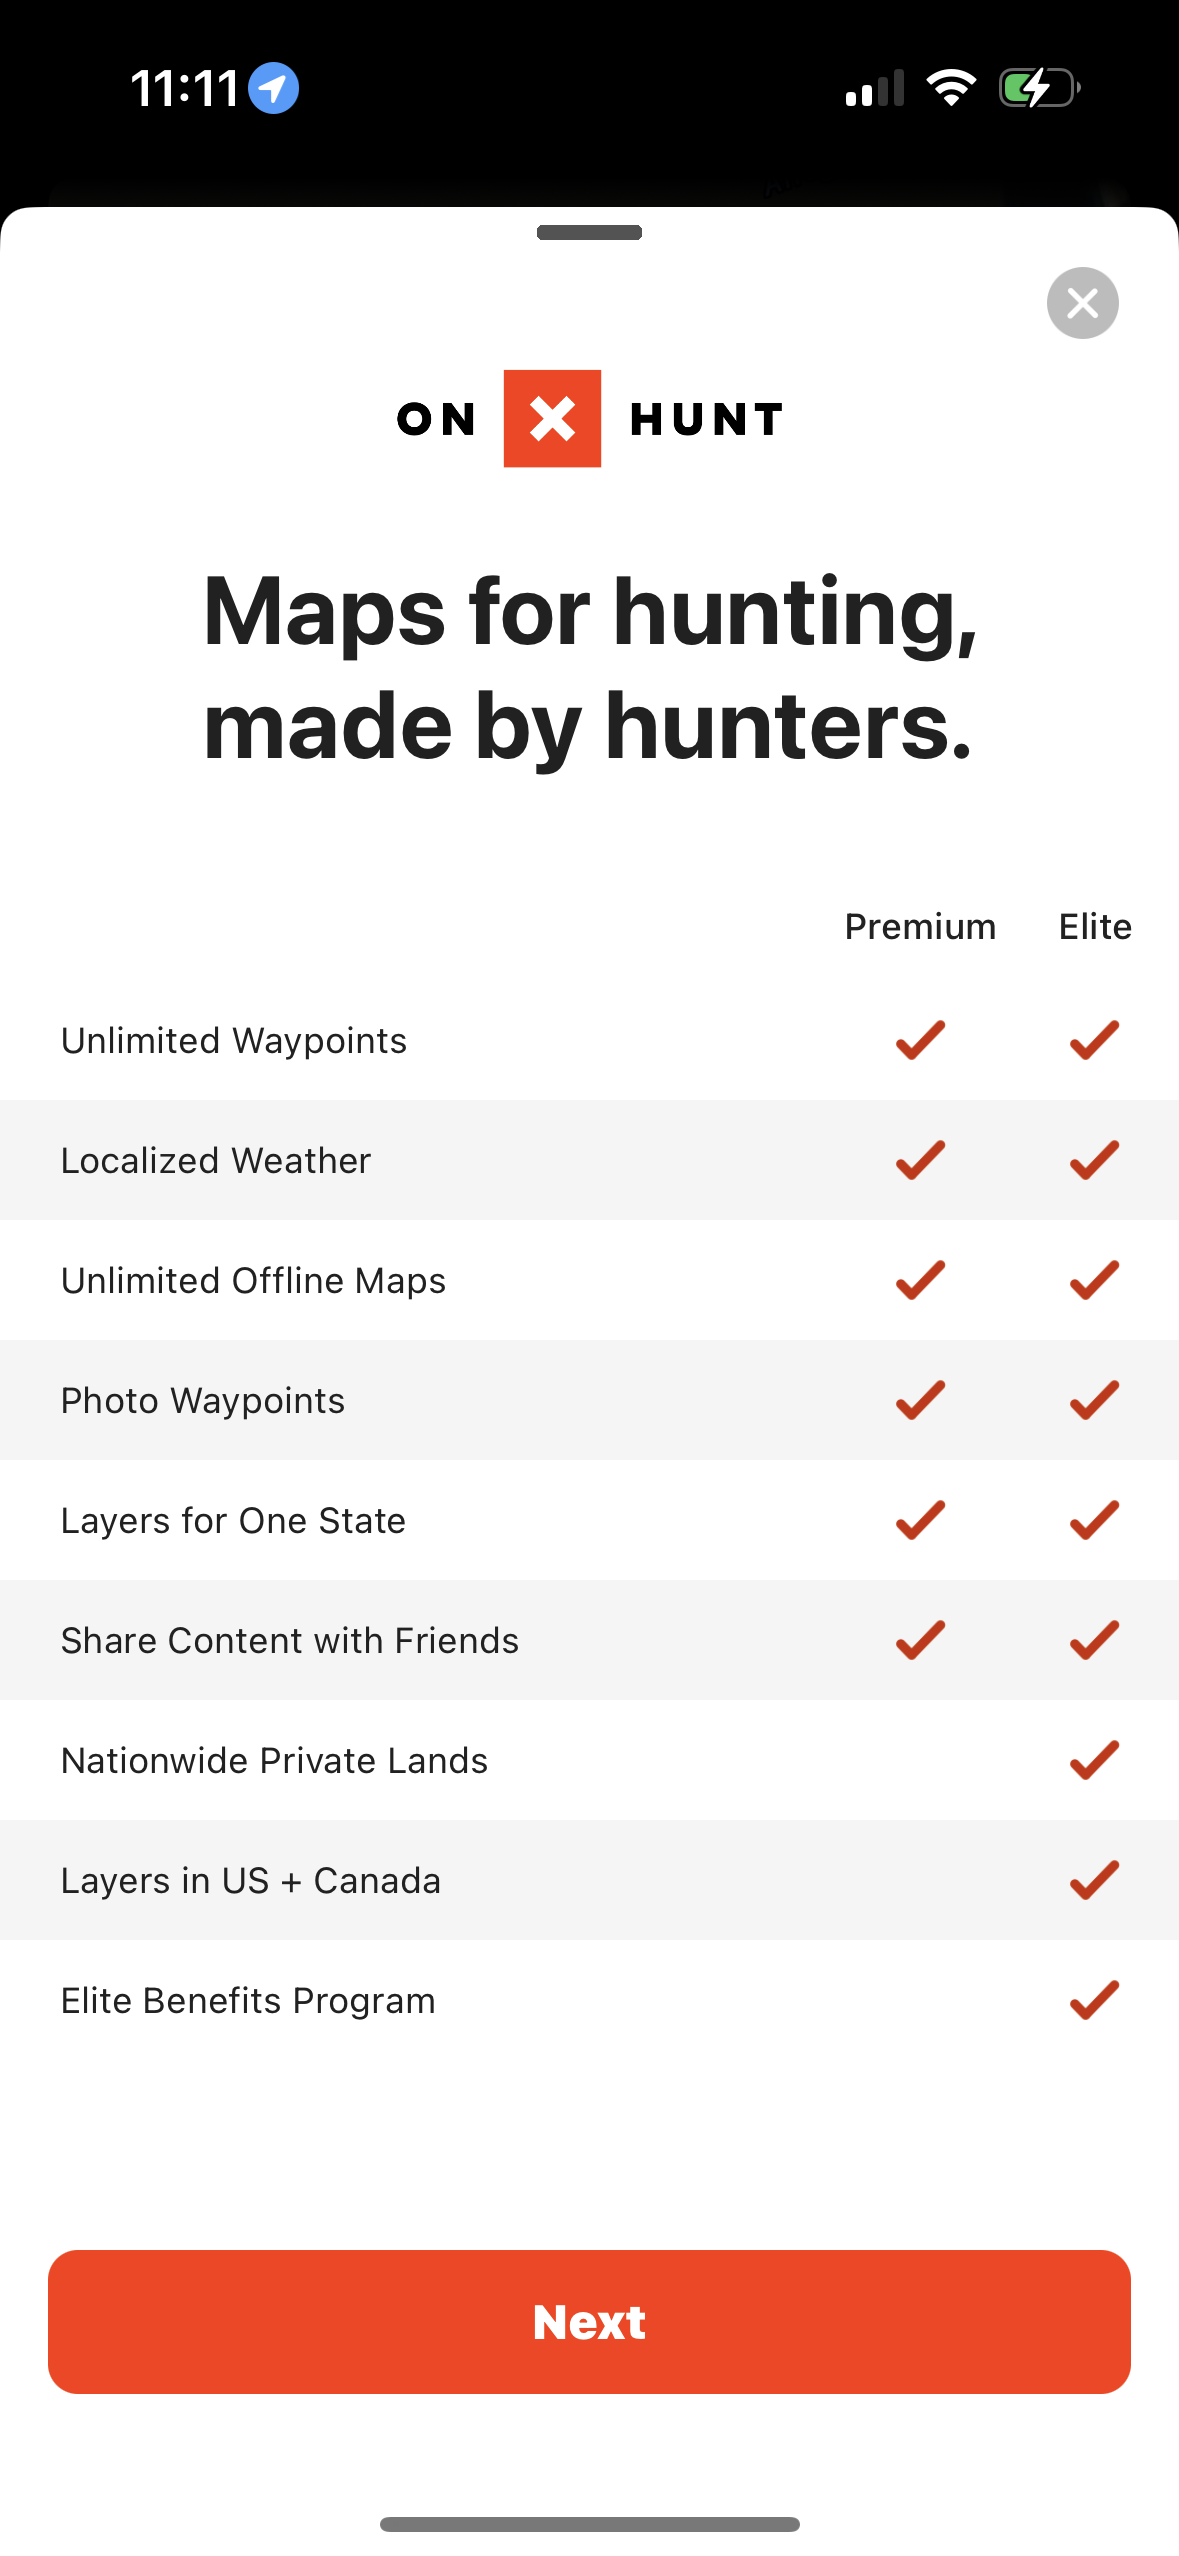
Onx Hunt1179 × 2556opens the full image - End of the visuals
The numbers
| # | Stat | Computed from |
|---|---|---|
| [1] | Photo & Video n=155 (15 cos): continue=29 (6 cos); subscribe=27 (1); start free trial=14 (4); get youtube premium=12 (1) | photo_video_top_ctas / category_primary_cta_totals |
| [2] | P&V buckets: free/trial 37 (23.9%); continue-led 31 (20.0%); price-in-button 16 (10.3%); urgency-broad 8 (5.2%) | photo_video_top_ctas |
Methodology
Universe: 155 primary paywall CTAs from 15 Photo & Video apps (joined on lower(company_name)), Supabase pull July 2026. Text lowercased/trimmed; buckets via regex. Caveat: 15 apps only; 'subscribe' and 'get youtube premium' are single-app — frame stats as 'of 155 CTAs from 15 apps'.
Sources
- [1]
Lazyweb Research analysis of 155 primary paywall CTAs from 15 Photo & Video apps (~800 tracked apps), July 2026
Photo & Video leaderboard; 'subscribe' (1 app) and 'get youtube premium' (YouTube) are single-app.
- [2]
Lazyweb Research analysis of 155 primary paywall CTAs from 15 Photo & Video apps (~800 tracked apps), July 2026
Copy-family buckets; per-vertical percentages published because n>=70.
Source: Lazyweb Research — proprietary analysis of real, in-market app screens. Cite as Lazyweb Research, 2026-07-07.