Which App Categories Paywall Most During Onboarding?
- By Ali Abouelatta
- n = 129
- Published
- Updated
- 2 min read
- paywall · onboarding · monetization · saas · mobile
Short answer
Across tracked verticals with at least 8 onboarding flows, Health & Fitness (54%, 14 of 26) and Education (54%, 7 of 13) paywall most in onboarding, while Productivity (1 of 11), Social Networking (0 of 10), and News (1 of 8) almost never do source[1]source[2]. The rate swings from a majority in wellness and learning apps to near zero in utility and social apps.
Onboarding paywall rates range from 54% in Health & Fitness to 0 of 10 in Social Networking, Lazyweb Research, July 2026.
Bar chart · Rate
Rate — Paywall rate by category
One block is about 1.9%
- Health & Fitness
- 54%
- Education
- 54%
- Photo & Video
- 33%
- News
- 13%
- Productivity
- 9%
- Social Networking
- 0%
The finding
Among verticals meeting the 8-flow floor, monetization-in-onboarding clusters in a few categories. Health & Fitness leads at 14 of 26 (54%) and Education matches at 7 of 13 (54%) source[1]. At the other end, Productivity has 1 paywall in 11 onboarding flows, Social Networking 0 in 10, and News 1 in 8 source[2].
Paywall rate by category
| Vertical | Flows | With paywall | Rate |
|---|---|---|---|
| Health & Fitness | 26 | 14 | 54% |
| Education | 13 | 7 | 54% |
| Photo & Video | 12 | 4 | 33% |
| News | 8 | 1 | 13% |
| Productivity | 11 | 1 | 9% |
| Social Networking | 10 | 0 | 0% |
Wellness and learning apps monetize in-onboarding; utility and social apps almost never do source[1]source[2]source[3].
How to apply it
Category is a strong prior for whether an in-onboarding paywall is normal. If you are in fitness, wellness, or education, a paywall in onboarding is expected. If you are in productivity, social, or news, an in-onboarding paywall is a departure from category norms — those apps typically defer monetization or rely on other surfaces.
Caveats
Every per-vertical N is below the ~70-flow percentage floor (Health & Fitness at 26 is the largest), so lead with absolute counts source[3]. Verticals under 8 onboarding flows (Travel 5, Finance 4, and others) were dropped source[3]. Detection is a floor because the paywall flag is sparse.
Real in-market screens
Screens from real, in-market apps, tracked by Lazyweb Research.
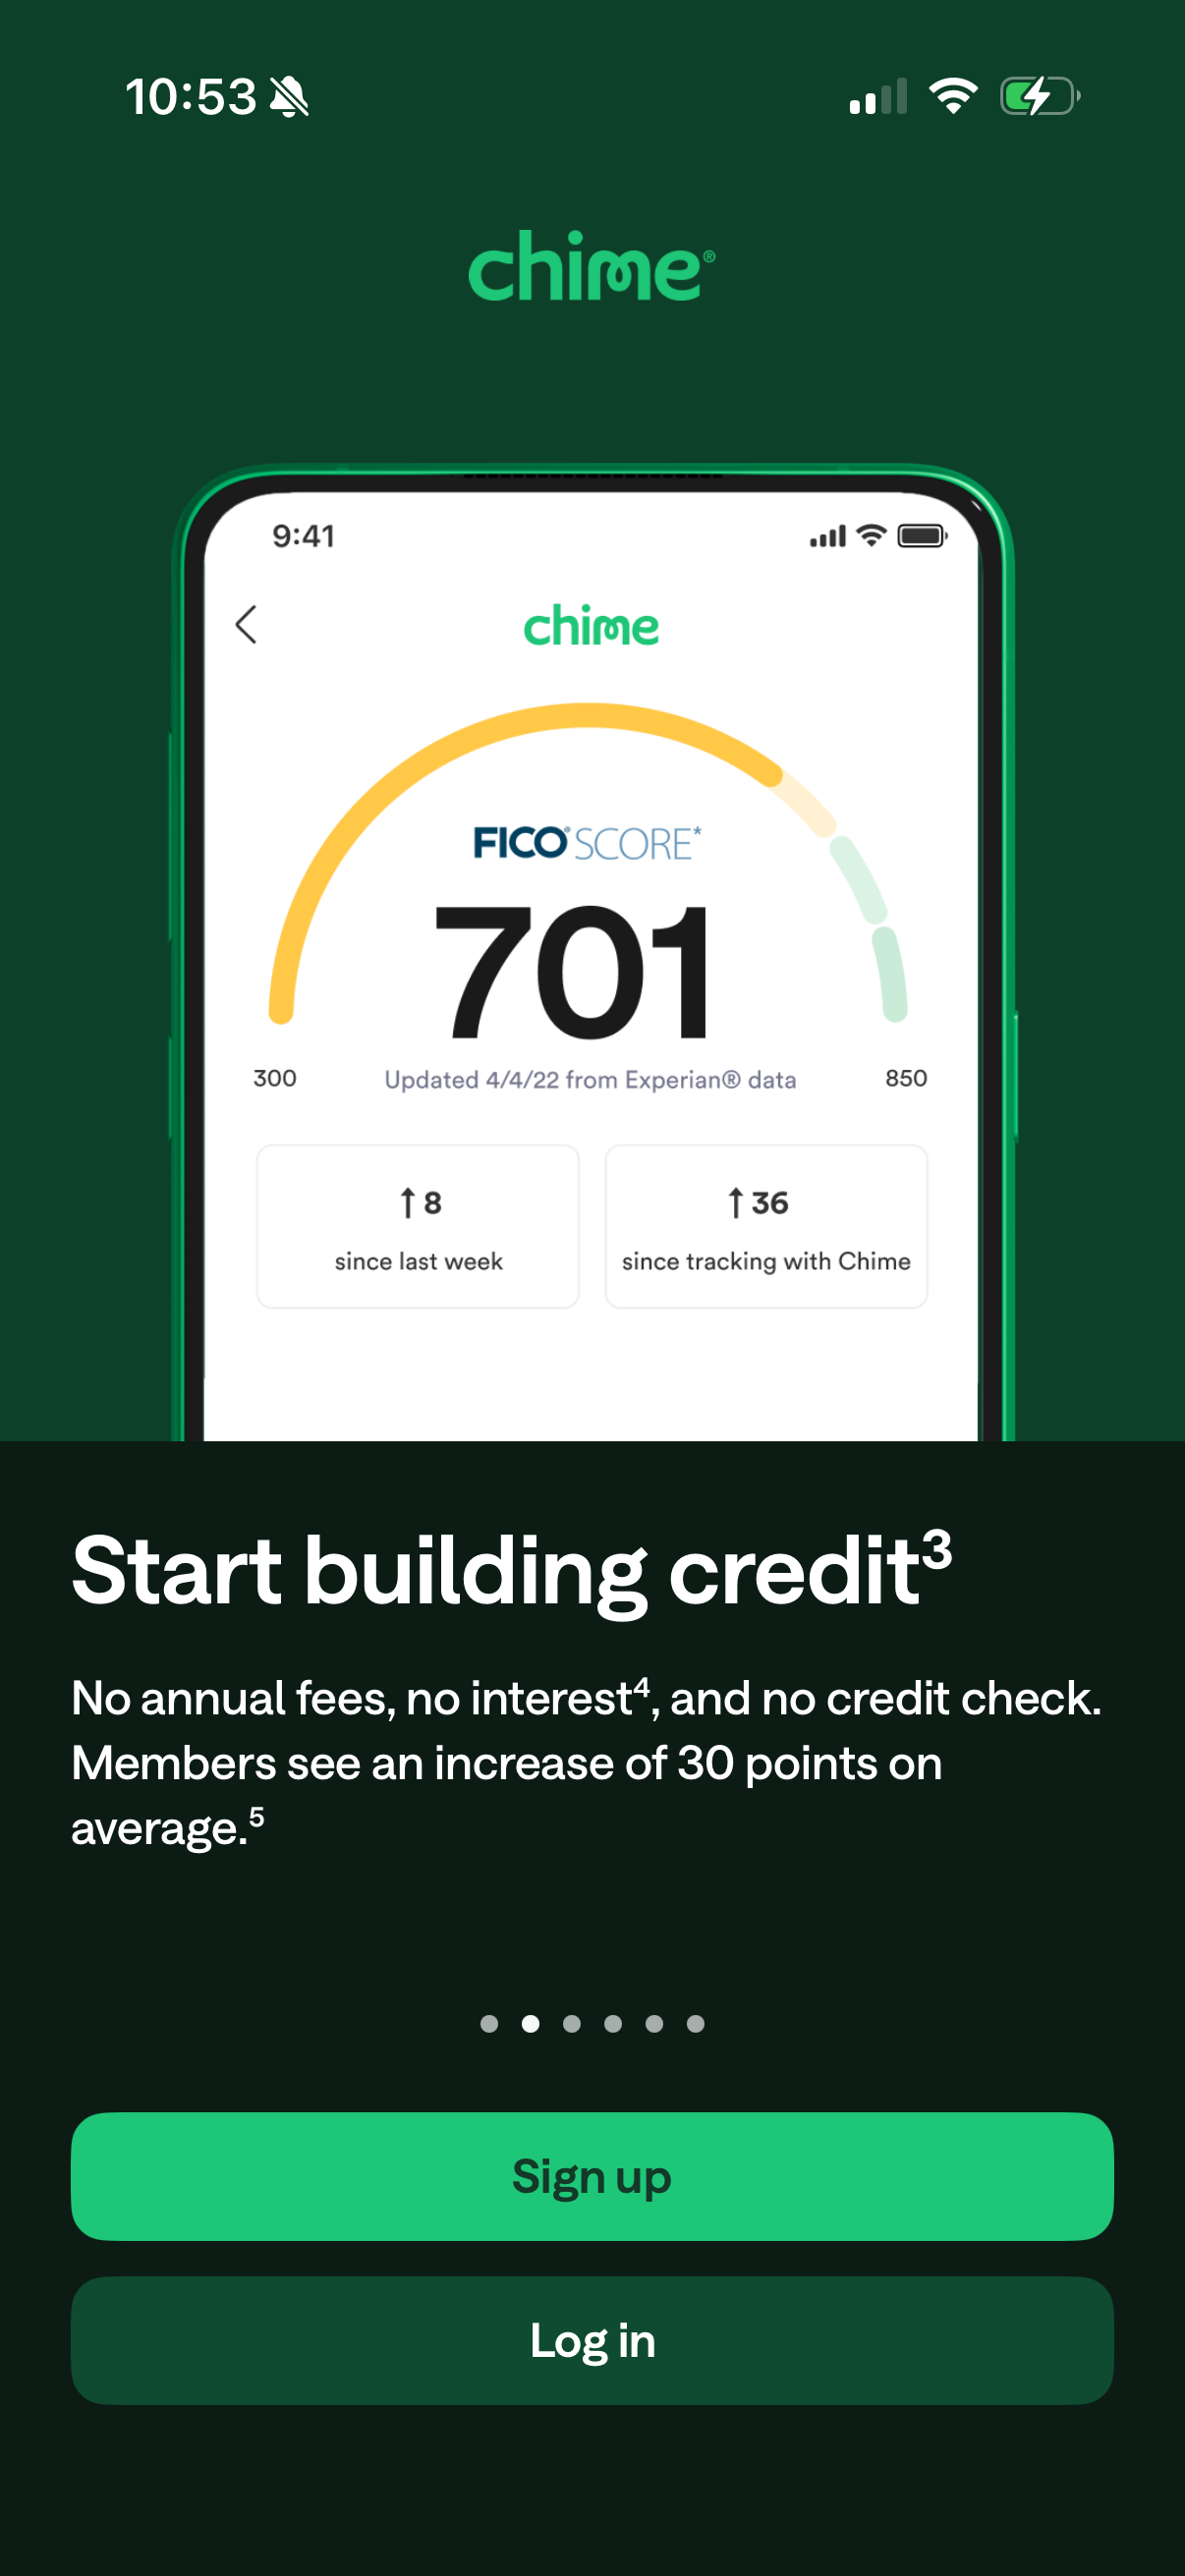
Chime1206 × 2622opens the full image 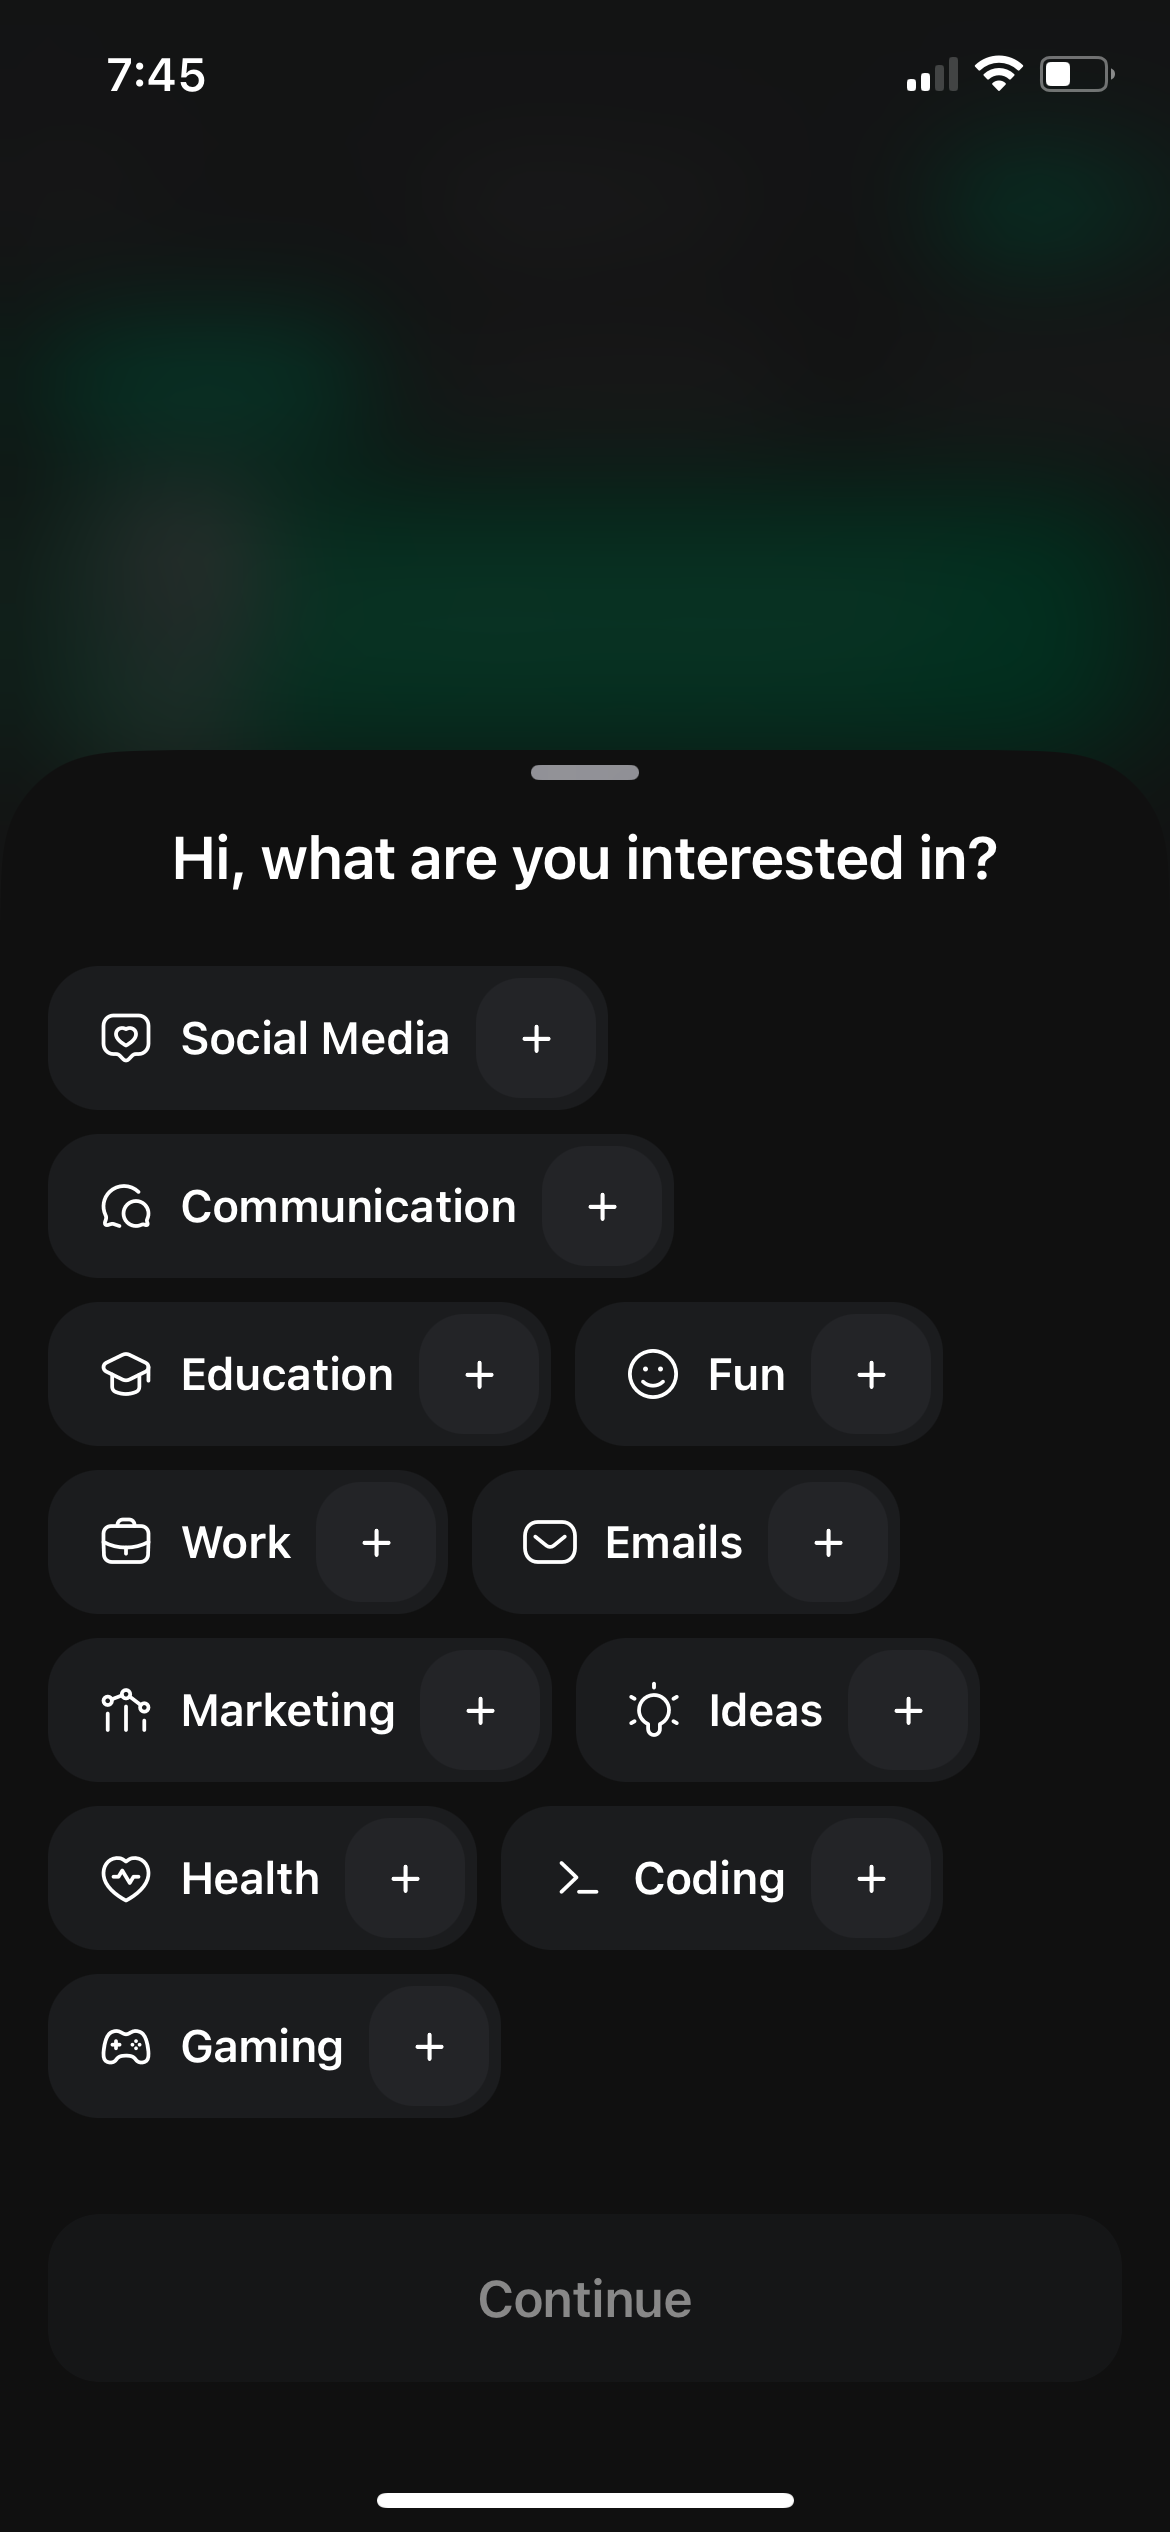
Chaton1170 × 2532opens the full image 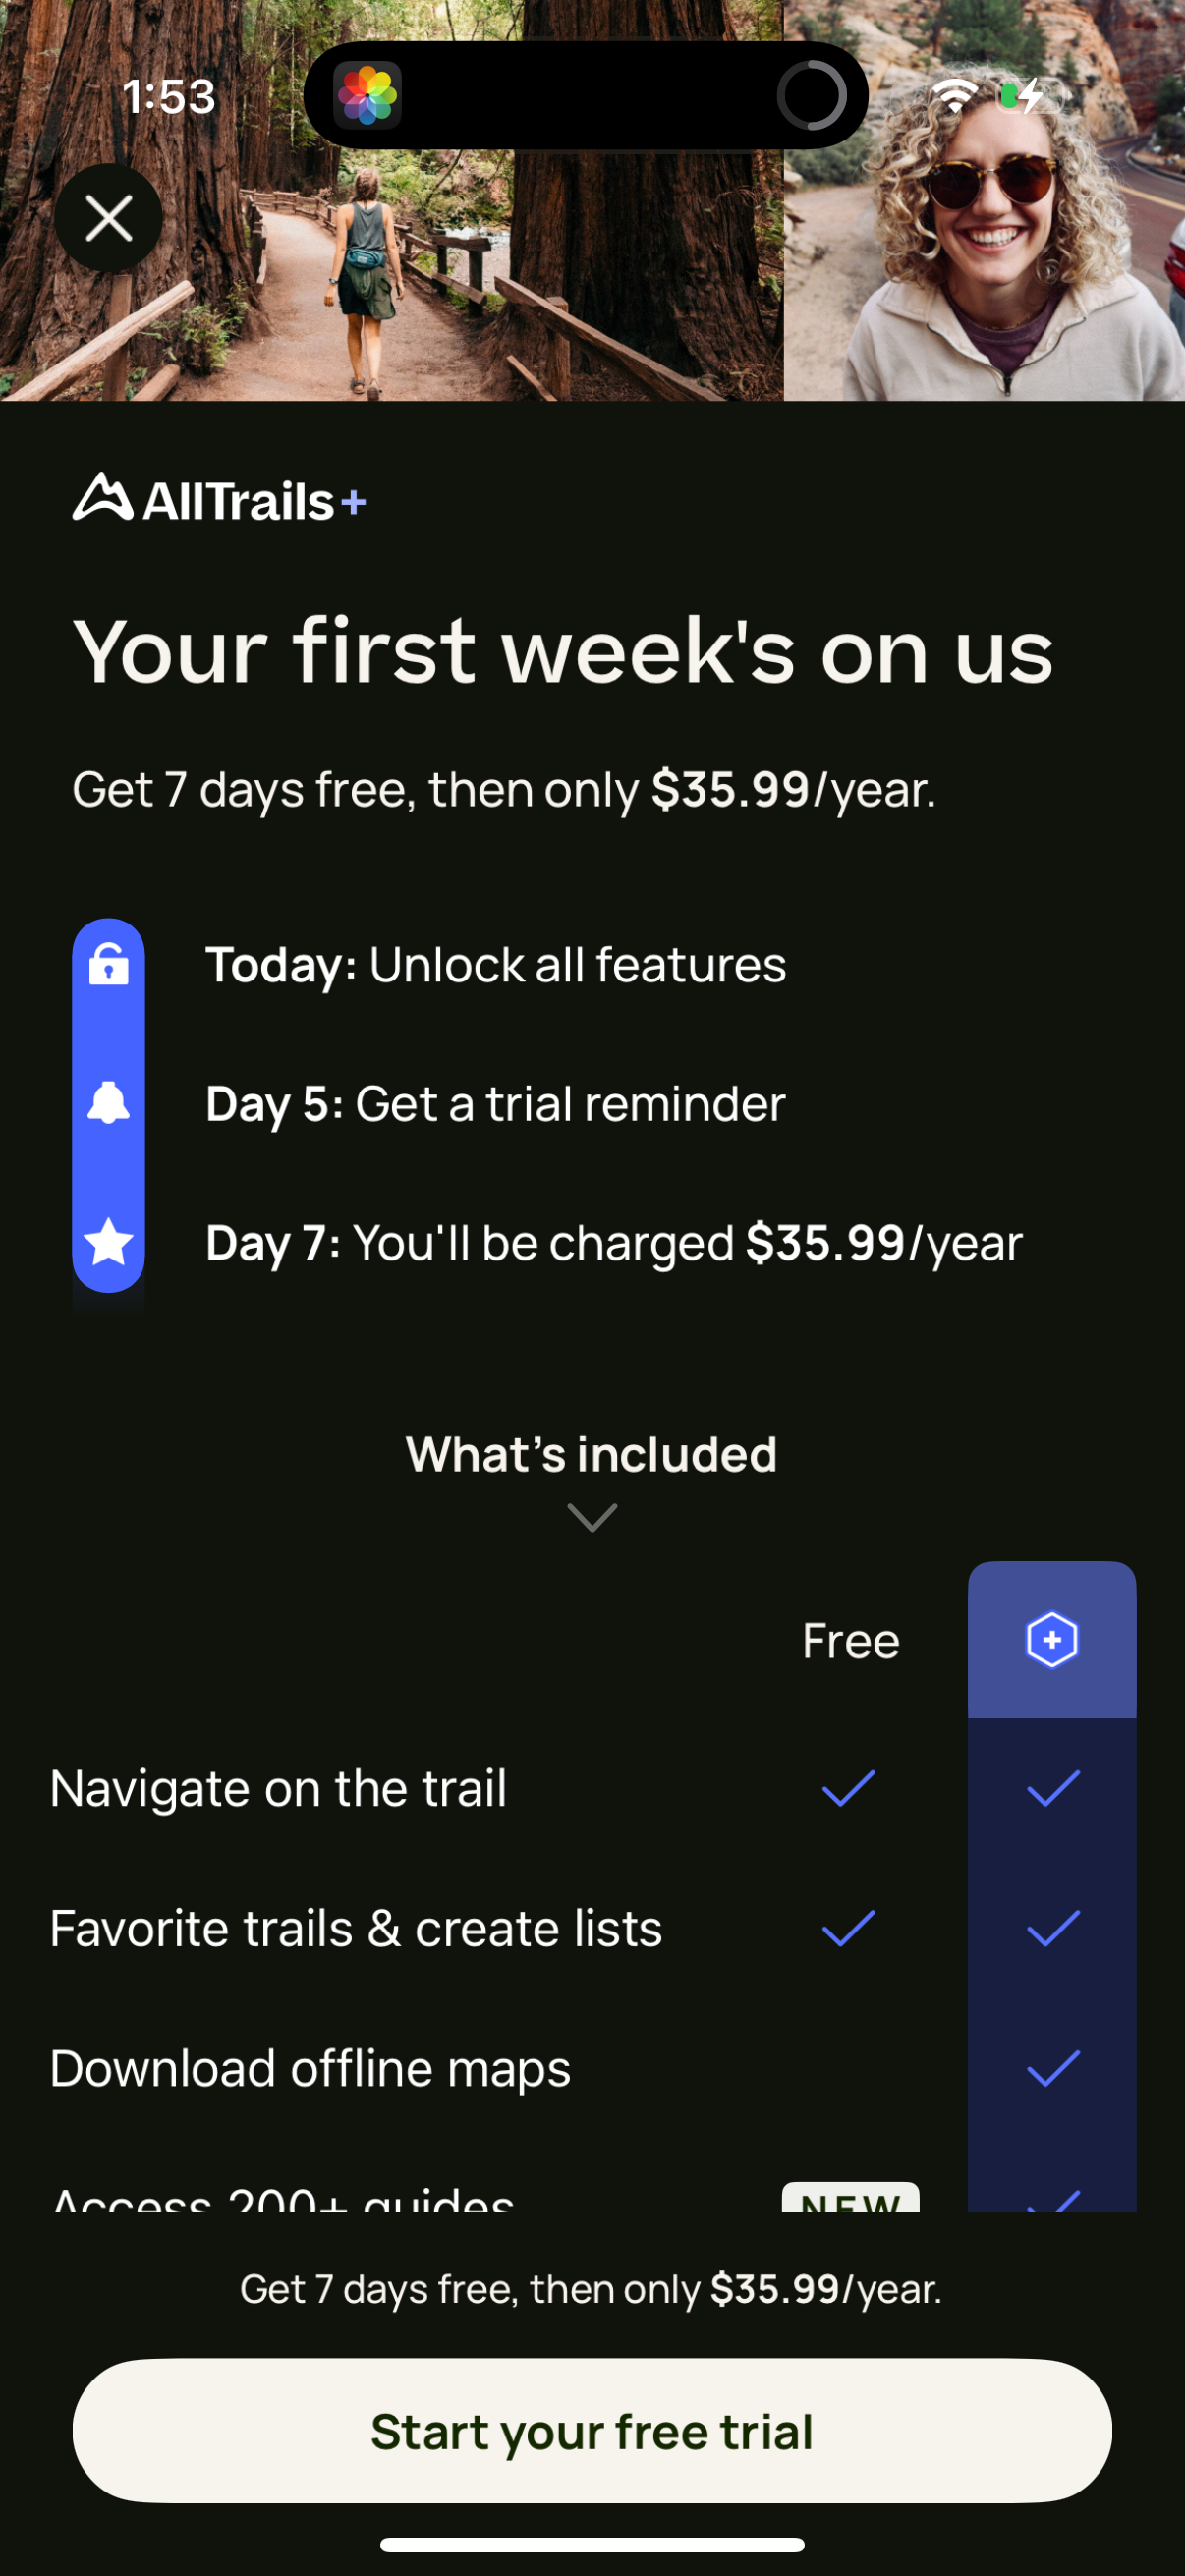
Alltrails1206 × 2622opens the full image 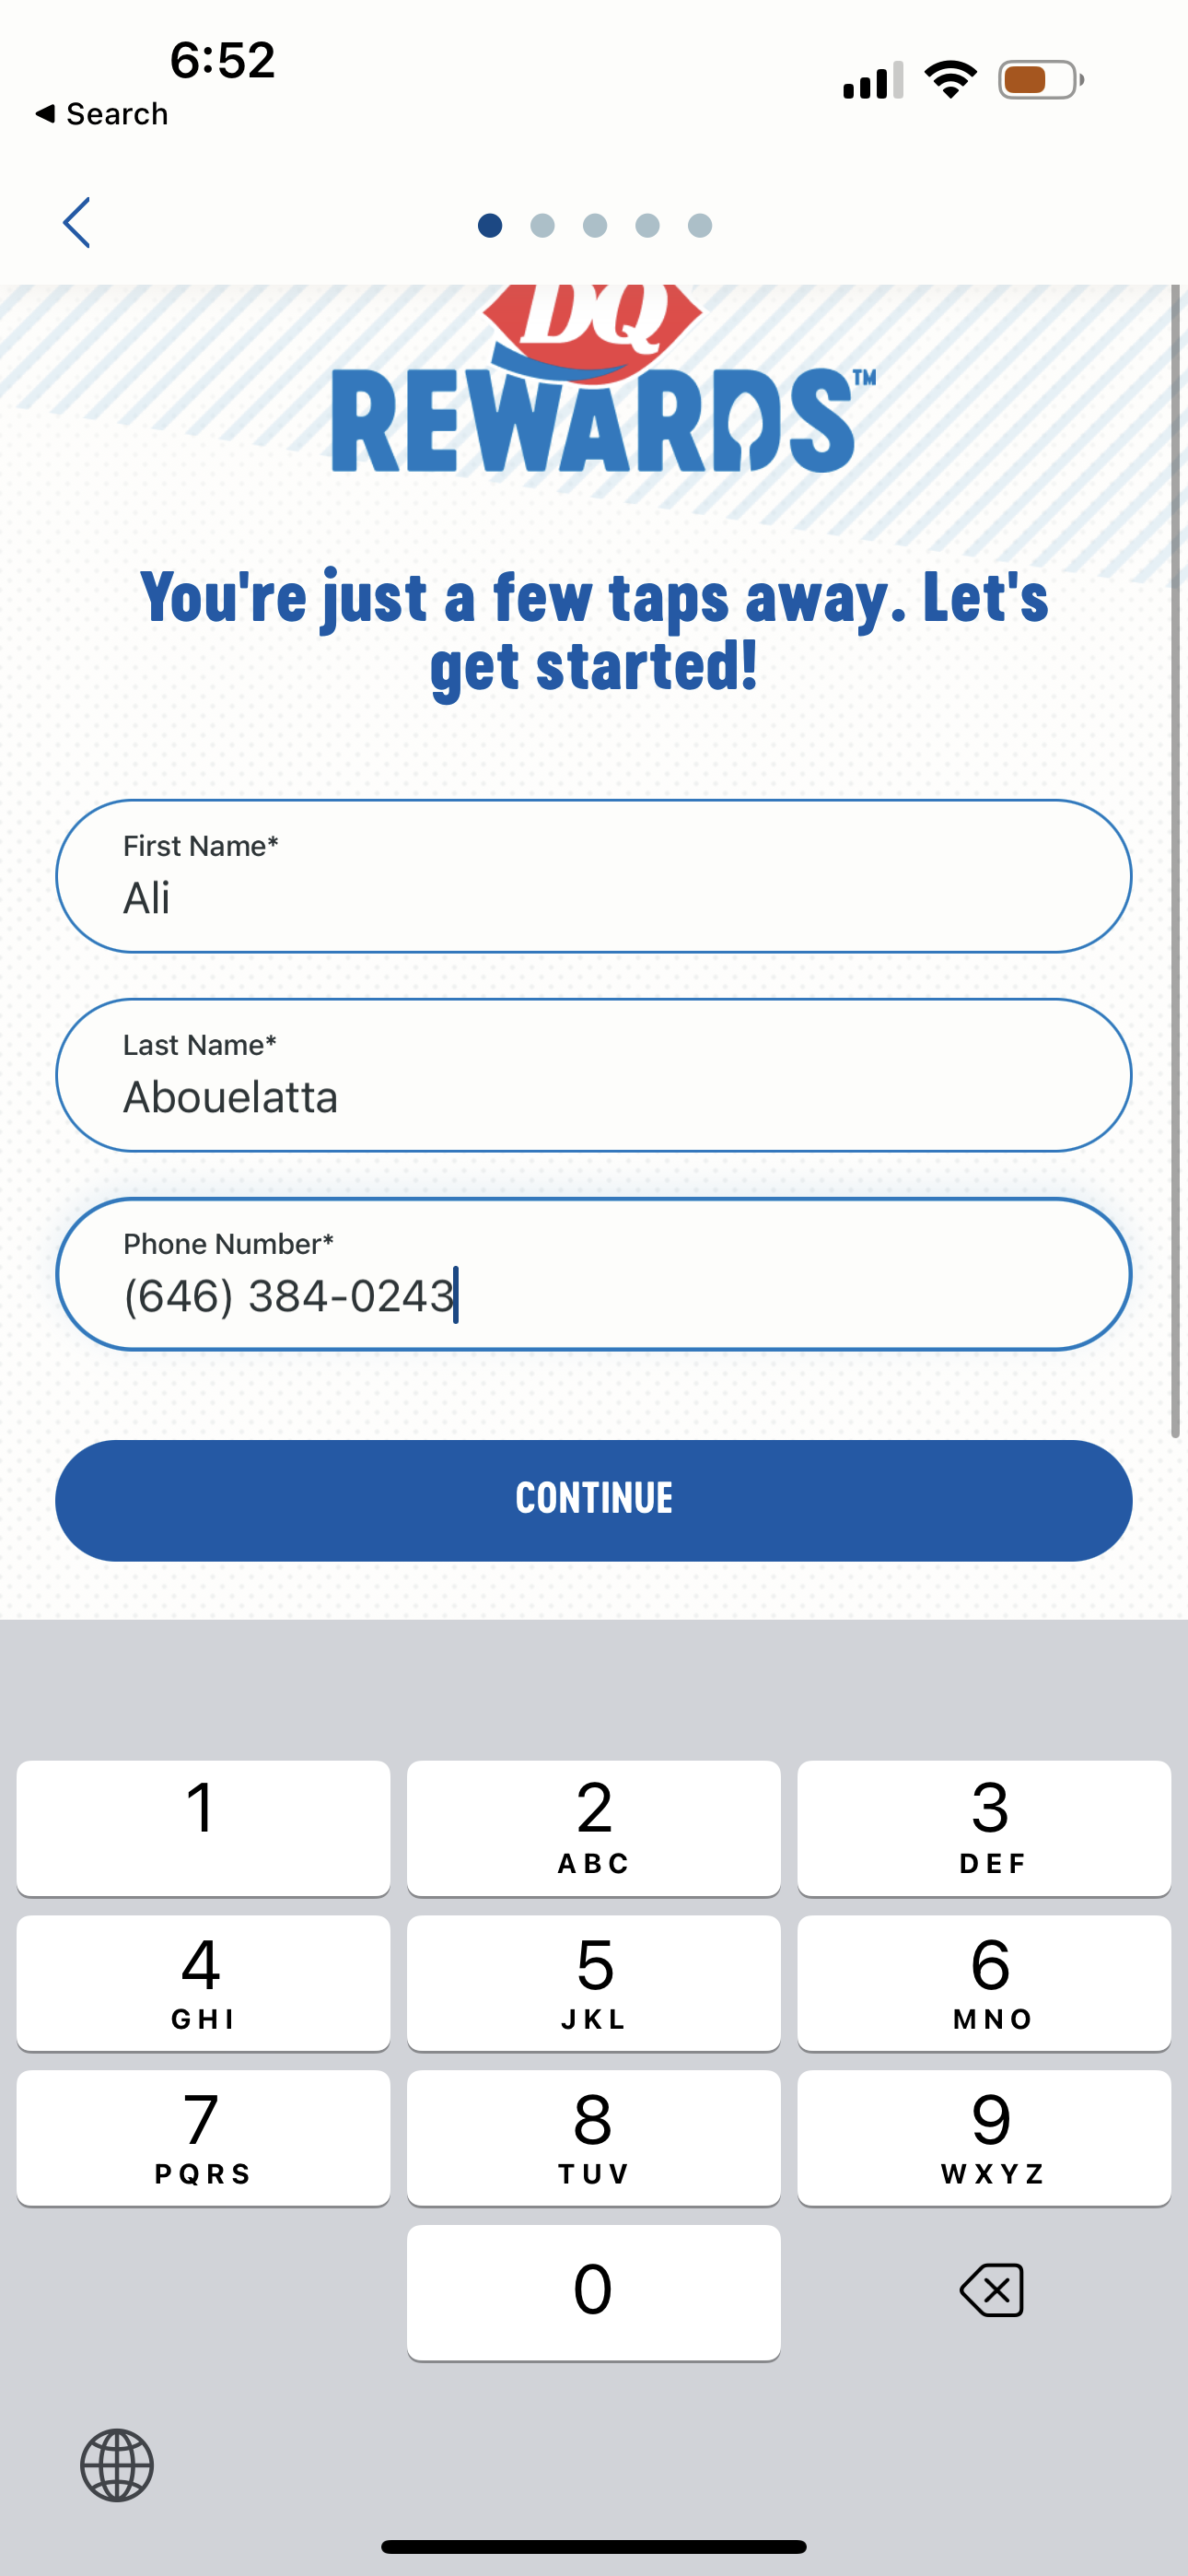
Dairy Queen1290 × 2796opens the full image
The numbers
| # | Stat | Computed from |
|---|---|---|
| [1] | Health & Fitness 14/26 (54%); Education 7/13 (54%) | vertical_health_fitness / vertical_education |
| [2] | Productivity 1/11; Social Networking 0/10; News 1/8 | vertical_contrast_low_paywall |
| [3] | Photo & Video 4/12; verticals under 8 flows dropped (Travel 5, Finance 4) | vertical_photo_video / smallSampleWarnings |
Methodology
Universe: onboarding flows by category (verticals with >=8 flows) of 129 across ~800 tracked apps, July 2026; category via companies.category. Caveat: all per-vertical Ns are small; cite absolute counts.
Sources
- [1]
Lazyweb Research analysis of Health & Fitness (26) and Education (13) onboarding flows (~800 tracked apps), July 2026
Per-vertical paywall counts via companies.category and is_paywall.
- [2]
Lazyweb Research analysis of Productivity (11), Social Networking (10), and News (8) onboarding flows (~800 tracked apps), July 2026
Low-paywall contrast verticals meeting the 8-flow floor.
- [3]
Lazyweb Research analysis of per-vertical onboarding flows (~800 tracked apps), July 2026
Photo & Video count; verticals under 8 flows dropped; all cuts below the percentage floor.
Source: Lazyweb Research — proprietary analysis of real, in-market app screens. Cite as Lazyweb Research, 2026-07-07.