How are top-grossing apps testing price increases?
Ali's top-100 grossing app review found that about 20% tested a price increase over six months, with an average increase of about 27%. Around a third of those tests pushed harder toward annual plans, while about 10% of observed pricing experiments were not successful.
- By Ali Abouelatta
- 4 visuals
- 1 min read
- monetization · pricing · subscription · experimentation
The evidence
The issue is data-report oriented: price increases are common, but the shape of the increase matters as much as the absolute price.
| # | Stat | Computed from |
|---|---|---|
| 01 | ~20% | Share of top-100 grossing apps that tested a price increase over six months |
| 02 | ~27% | Average size of the price increase in the reviewed set |
| 03 | ~1/3 | Share of those price tests that pushed harder toward annual plans |
| 04 | ~10% | Share of observed pricing experiments that were not successful |
What changed
- Some apps raised monthly and annual prices together.
- Some apps raised monthly pricing more aggressively to make annual plans more attractive.
- Lifetime and weekly plans appeared more robust to price increases in the reviewed set.
Why it matters
- A price increase is also a packaging experiment.
- The annual-plan nudge can be built through relative pricing, not only discount copy.
Every visual
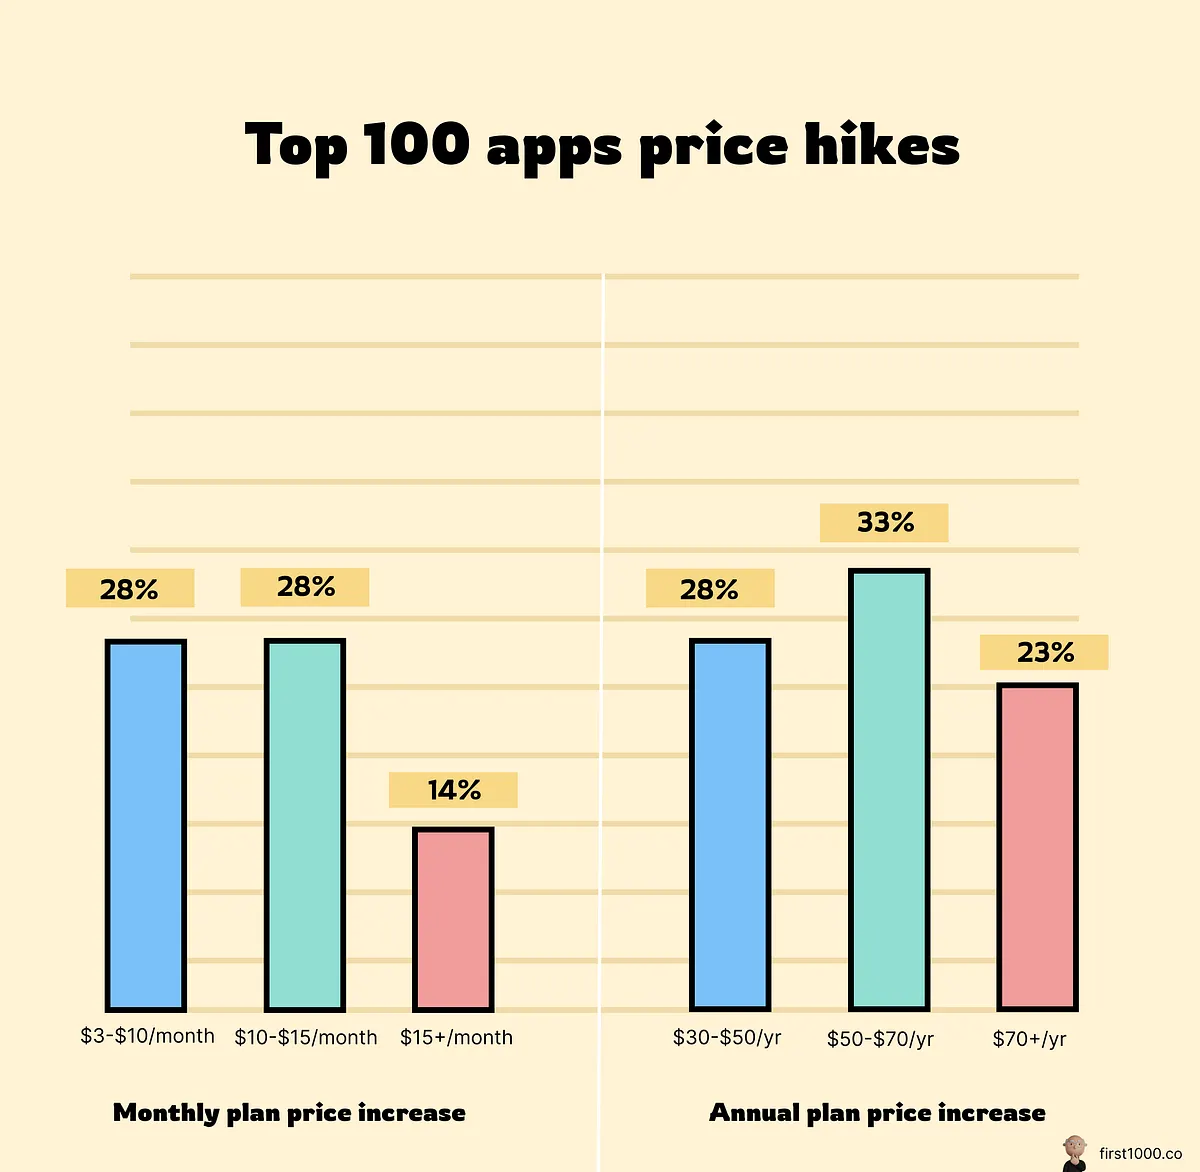
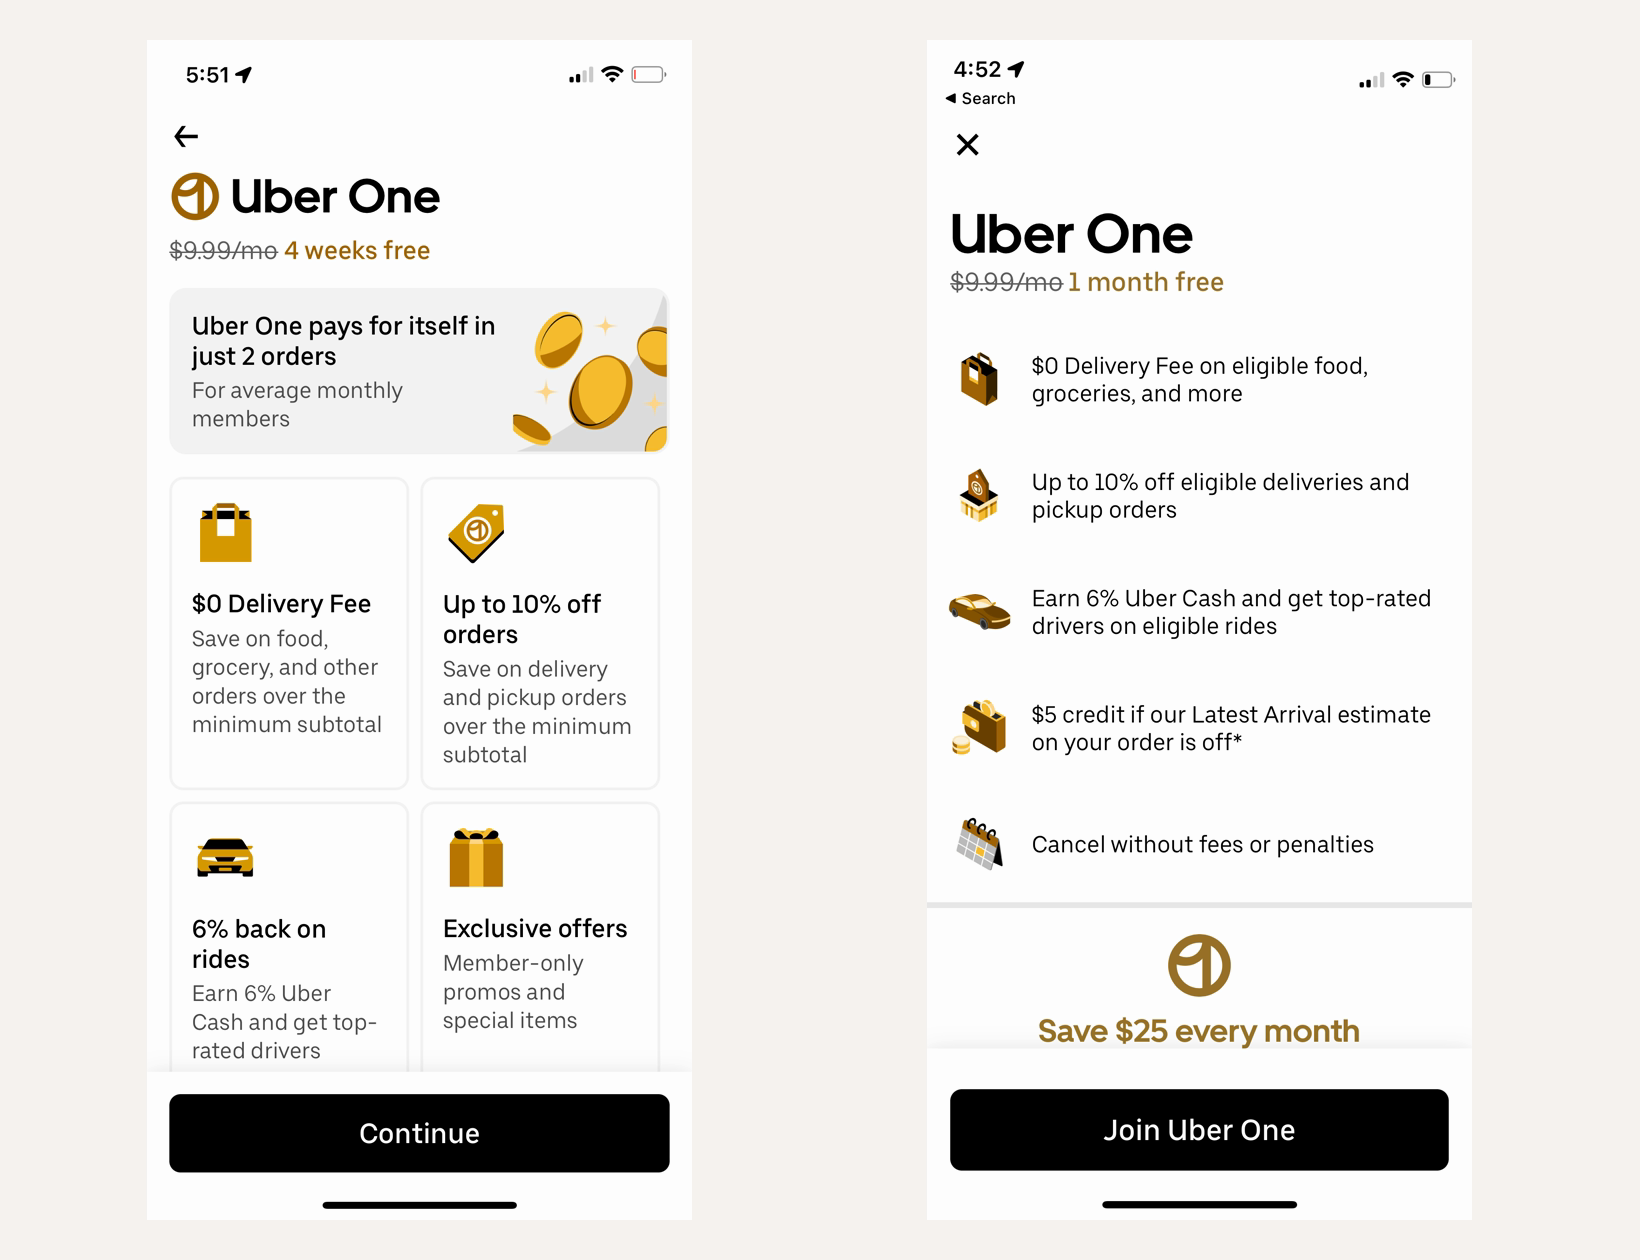
A subscription pricing screenshot compares plan options and shows how apps structure price tests.1200 × 1172opens the full image 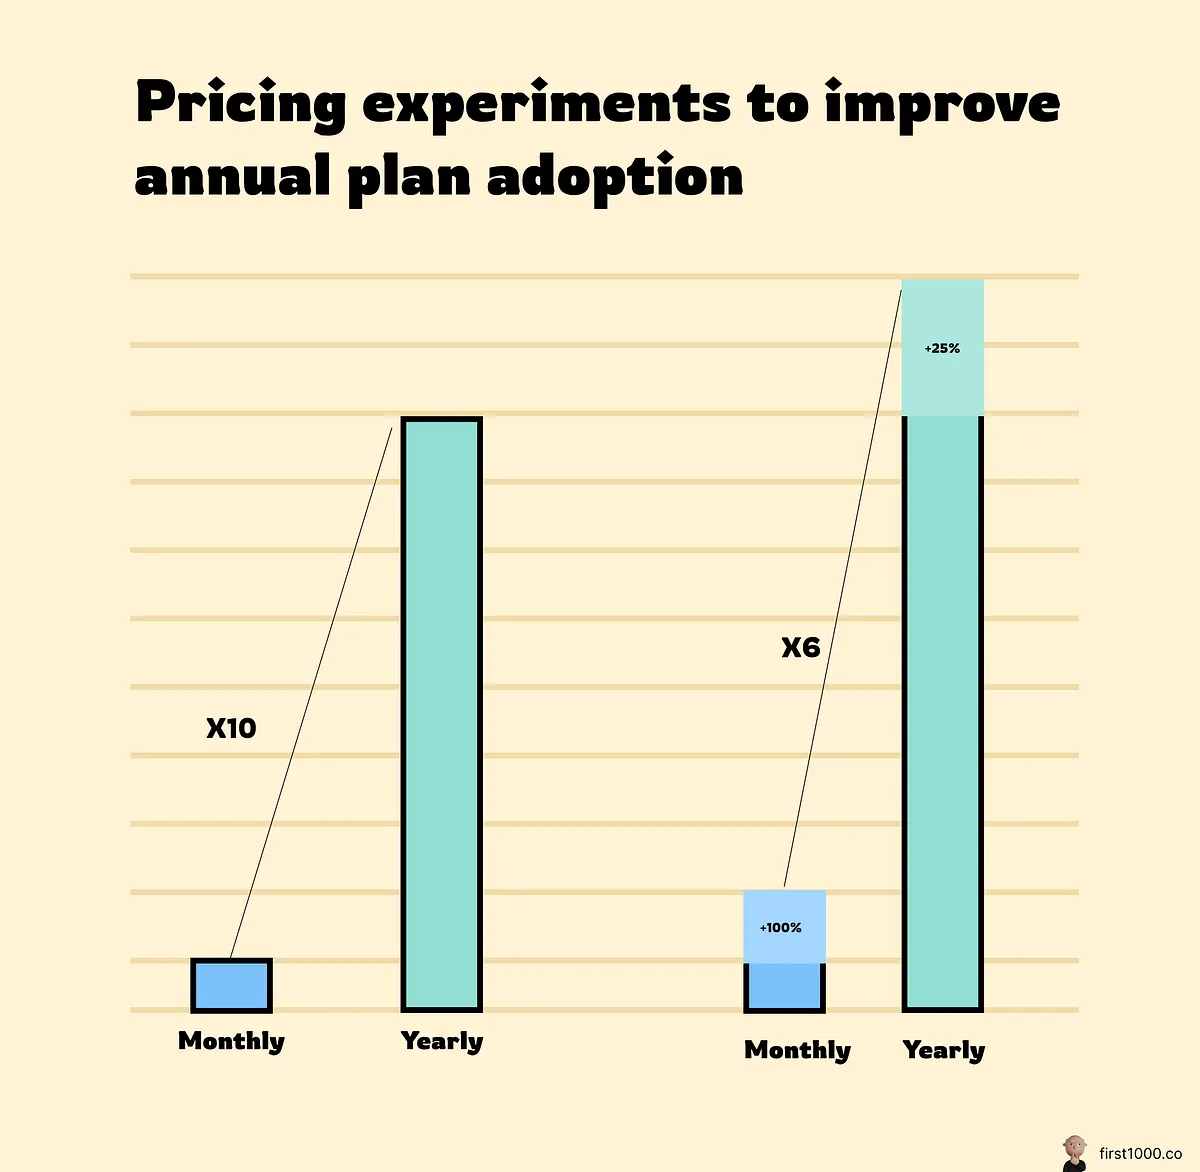
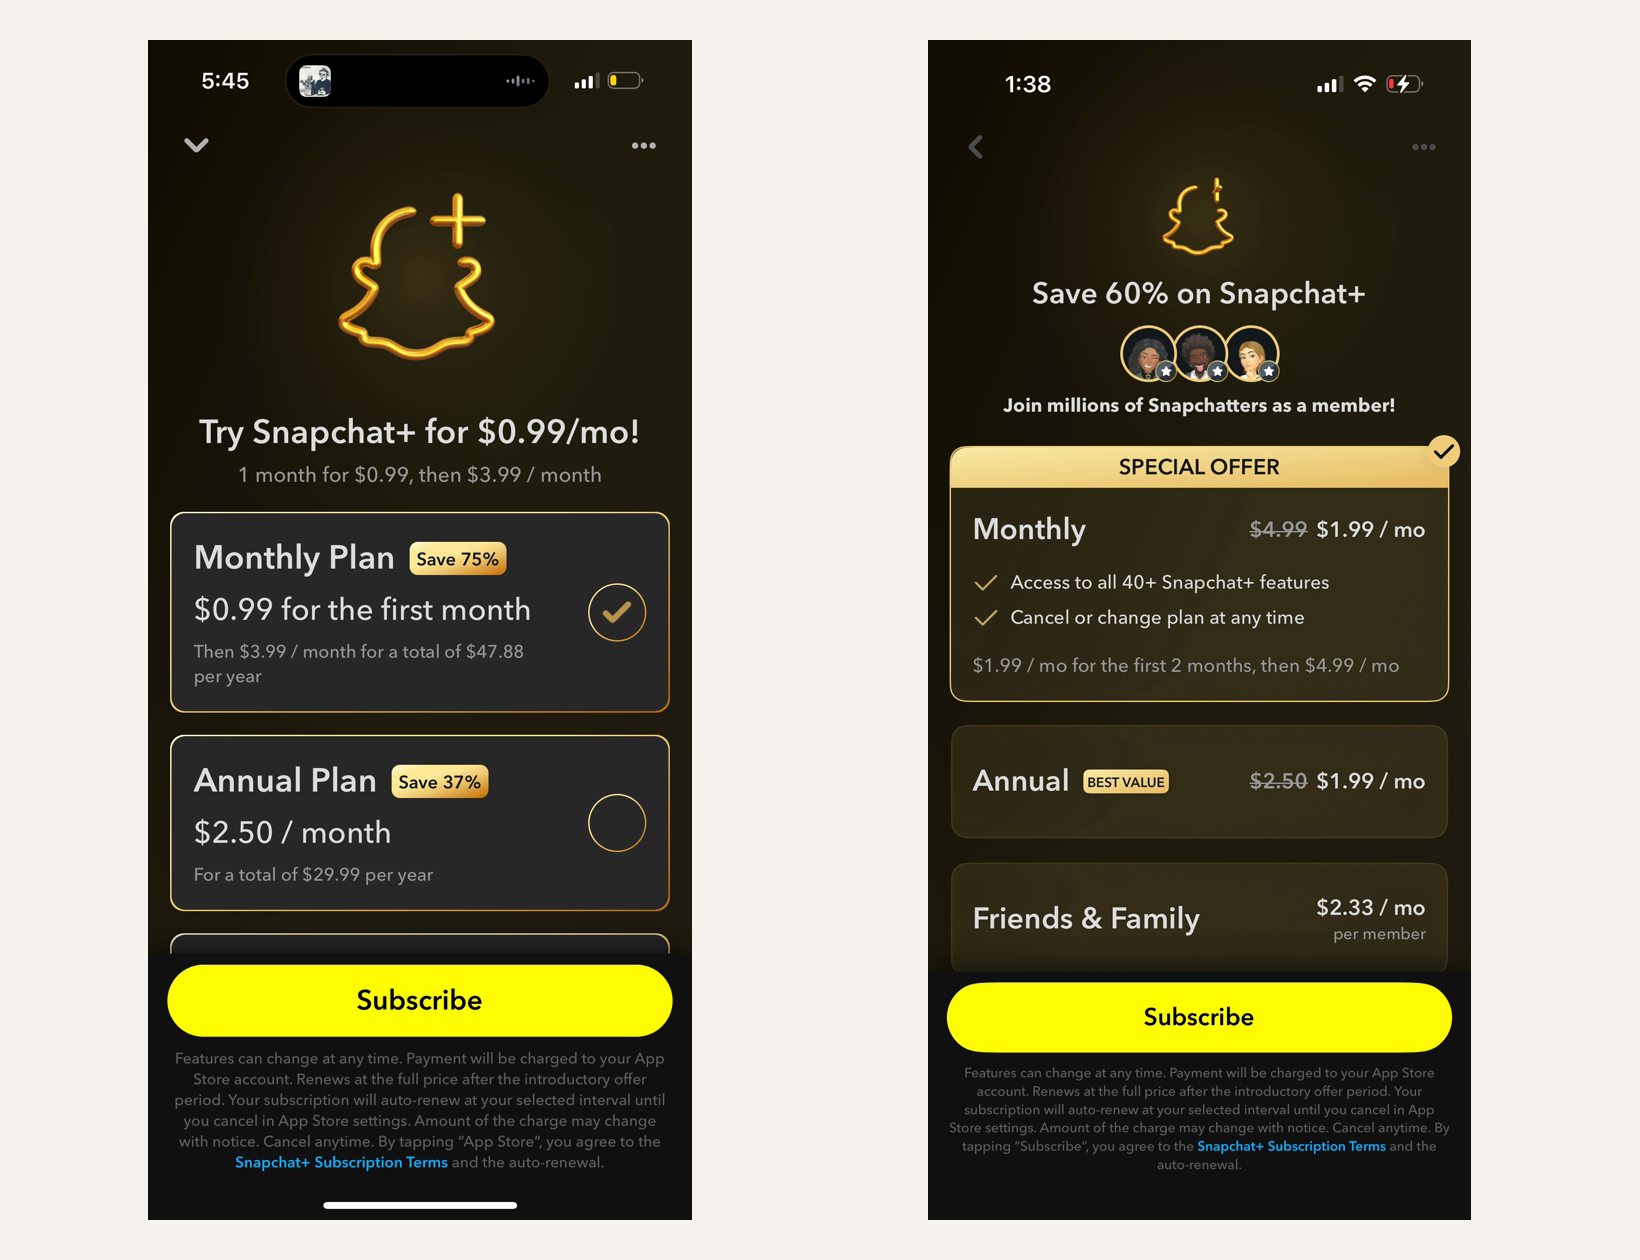
Another pricing screenshot shows how monthly and annual prices can shift relative to one another.1200 × 1172opens the full image 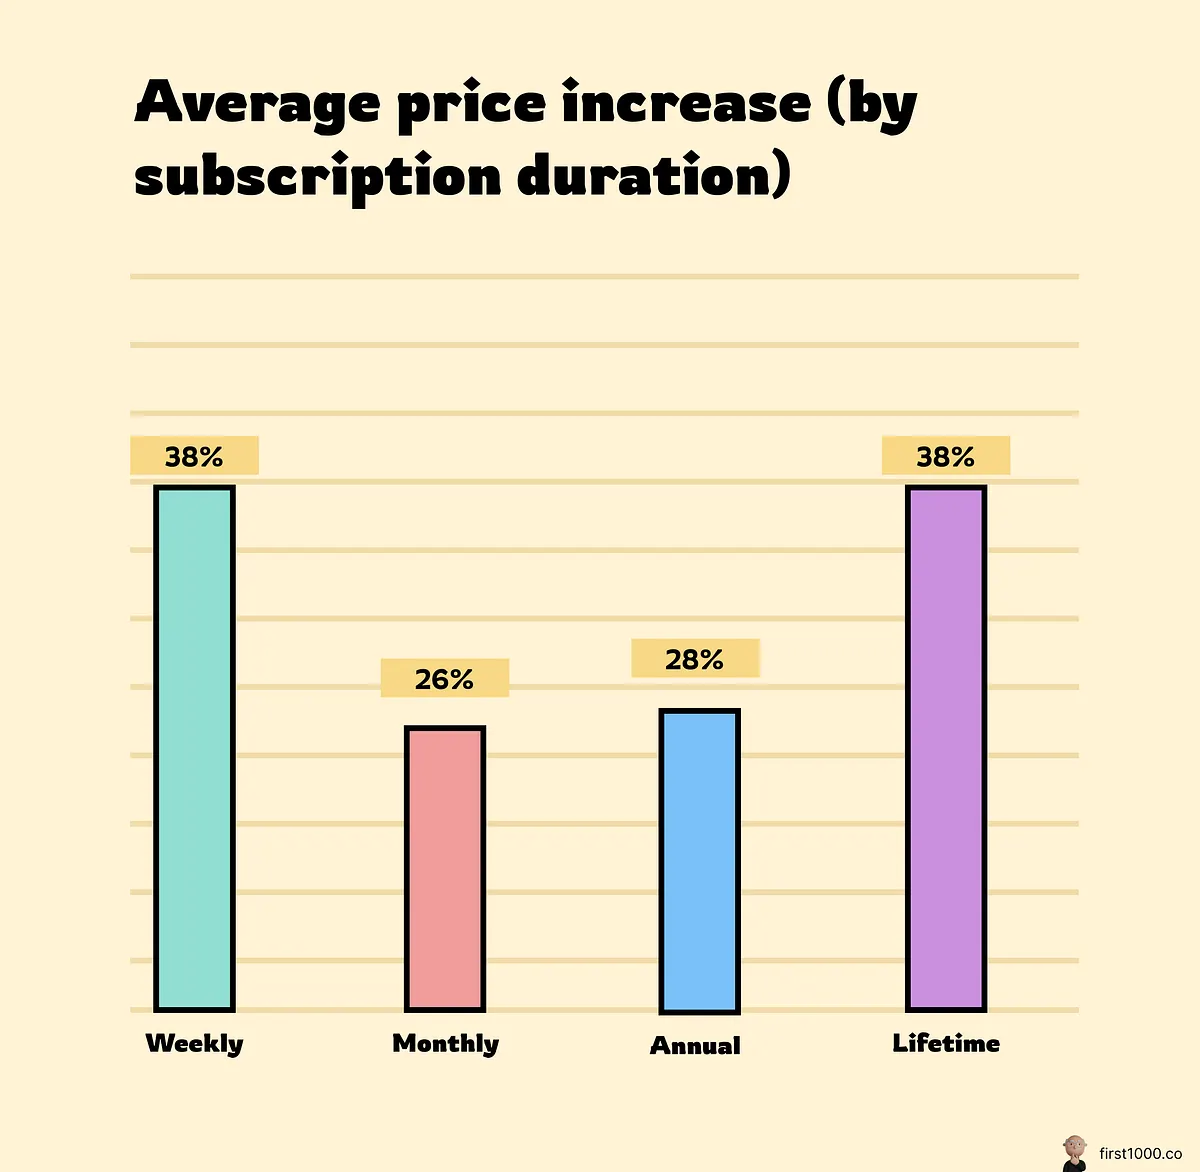
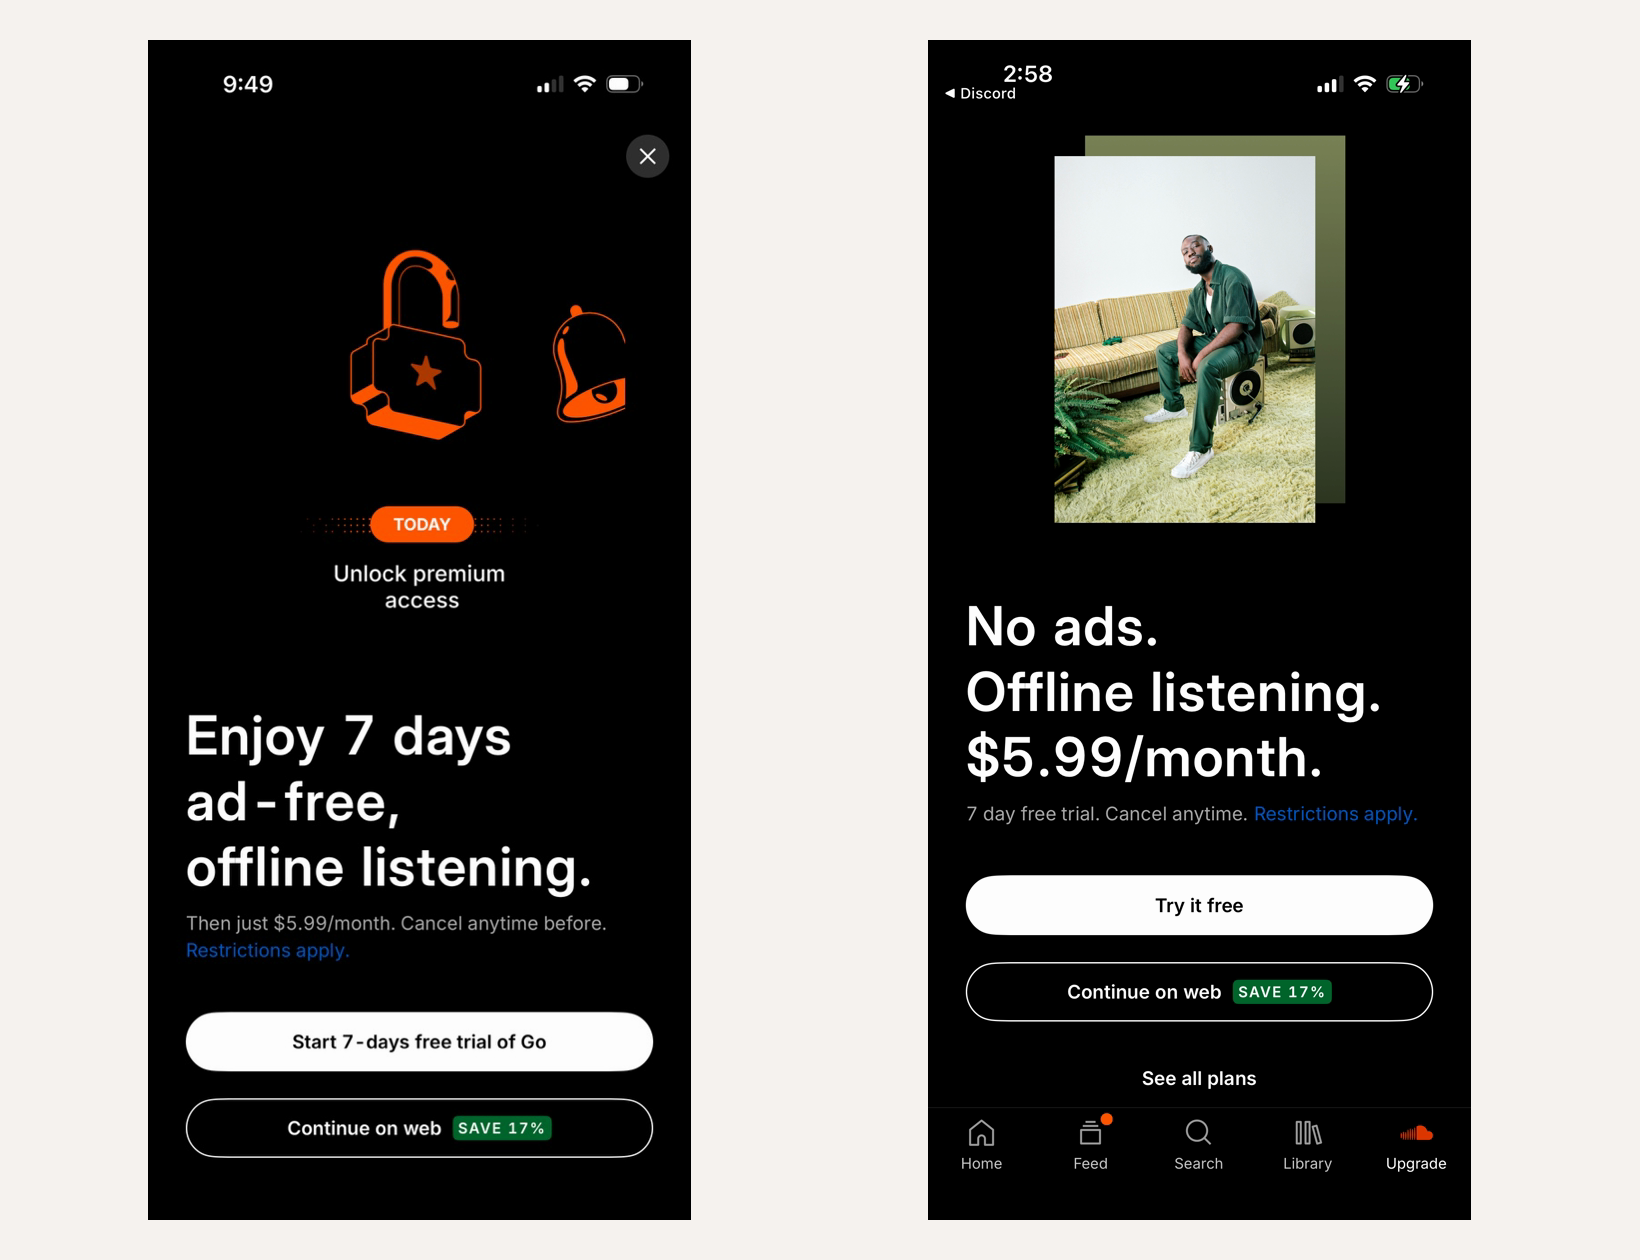
A third pricing screenshot documents another plan-price configuration from the top-grossing app review.1200 × 1172opens the full image
Sources
- [1]
Lazyweb Research: top-100 app pricing experiments
Reports about 20% of top-100 grossing apps tested price increases, the average increase was about 27%, about a third pushed annual plans, and about 10% were unsuccessful.
Methodology
Product-experiment write-up by Ali Abouelatta, dated on March 1, 2024. Source links are listed below.