Which Page Areas Get Tested Most — And Where Does the Hero Rank?
- By Ali Abouelatta
- n = 4,814
- Published
- Updated
- 2 min read
- experiments · landing-page · design · ux-patterns · paywall
Short answer
Across the 4,814 detected experiments Lazyweb Research tracks, the hero is the most-annotated change area at 405 experiments, ahead of offer (281), pricing (229), CTA (225), and value props (178).source[1]source[2] Media swaps make up 307 of the hero-touching experiments, across 122 companies.source[3]
The hero leads all page areas with 405 annotated experiments — more than offer (281), pricing (229), or CTA (225) — Lazyweb Research, July 2026 (n=4,814).
Bar chart · Experiments
Experiments — The finding: heroes and offers dominate testing attention
One block is about 14.5 Experiments
- Hero
- 405
- Offer
- 281
- Pricing
- 229
- CTA
- 225
- Value props
- 178
- Nav
- 135
- Secondary actions
- 107
- Announcement bar
- 62
- Legal / trust
- 56
- Social proof
- 48
The finding: heroes and offers dominate testing attention
Ranked by distinct annotated experiments, the most-tested page areas are:
| Area | Experiments |
|---|---|
| Hero | 405 |
| Offer | 281 |
| Pricing | 229 |
| CTA | 225 |
| Value props | 178 |
| Nav | 135 |
| Secondary actions | 107 |
| Announcement bar | 62 |
| Legal / trust | 56 |
| Social proof | 48 |
Source: annotated change-area breakdown across the corpus.source[1] The hero and the offer together account for the bulk of top-of-funnel experimentation.
Where hero media fits
Of the 405 hero-area experiments, media swaps (hero co-occurring with image/video/illustration/media/visual/animation) account for 307 across 122 companies.source[3] A smaller slice — 18 experiments — put social proof or 'trusted by' content into the hero specifically.source[4] So most hero testing is about the visual asset and headline, with social proof a minority hero move.
How to apply it
If you are prioritizing where to run your next test, peers concentrate on the hero and offer. Lower-ranked areas — announcement bar (62), legal/trust (56), social proof (48) — are tested far less, which can mean either they matter less or they are under-explored opportunity.source[1] Treat the ranking as 'where attention goes,' not 'where impact is,' since these are counts of detected changes, not outcomes.
Caveats
Area labels are LLM annotations; variants like value props/features were merged before counting.source[2] These are detected UI diffs, not measured lifts, so a high test count reflects effort and ease, not proven return.
Real in-market screens
Screens from real, in-market apps, tracked by Lazyweb Research.
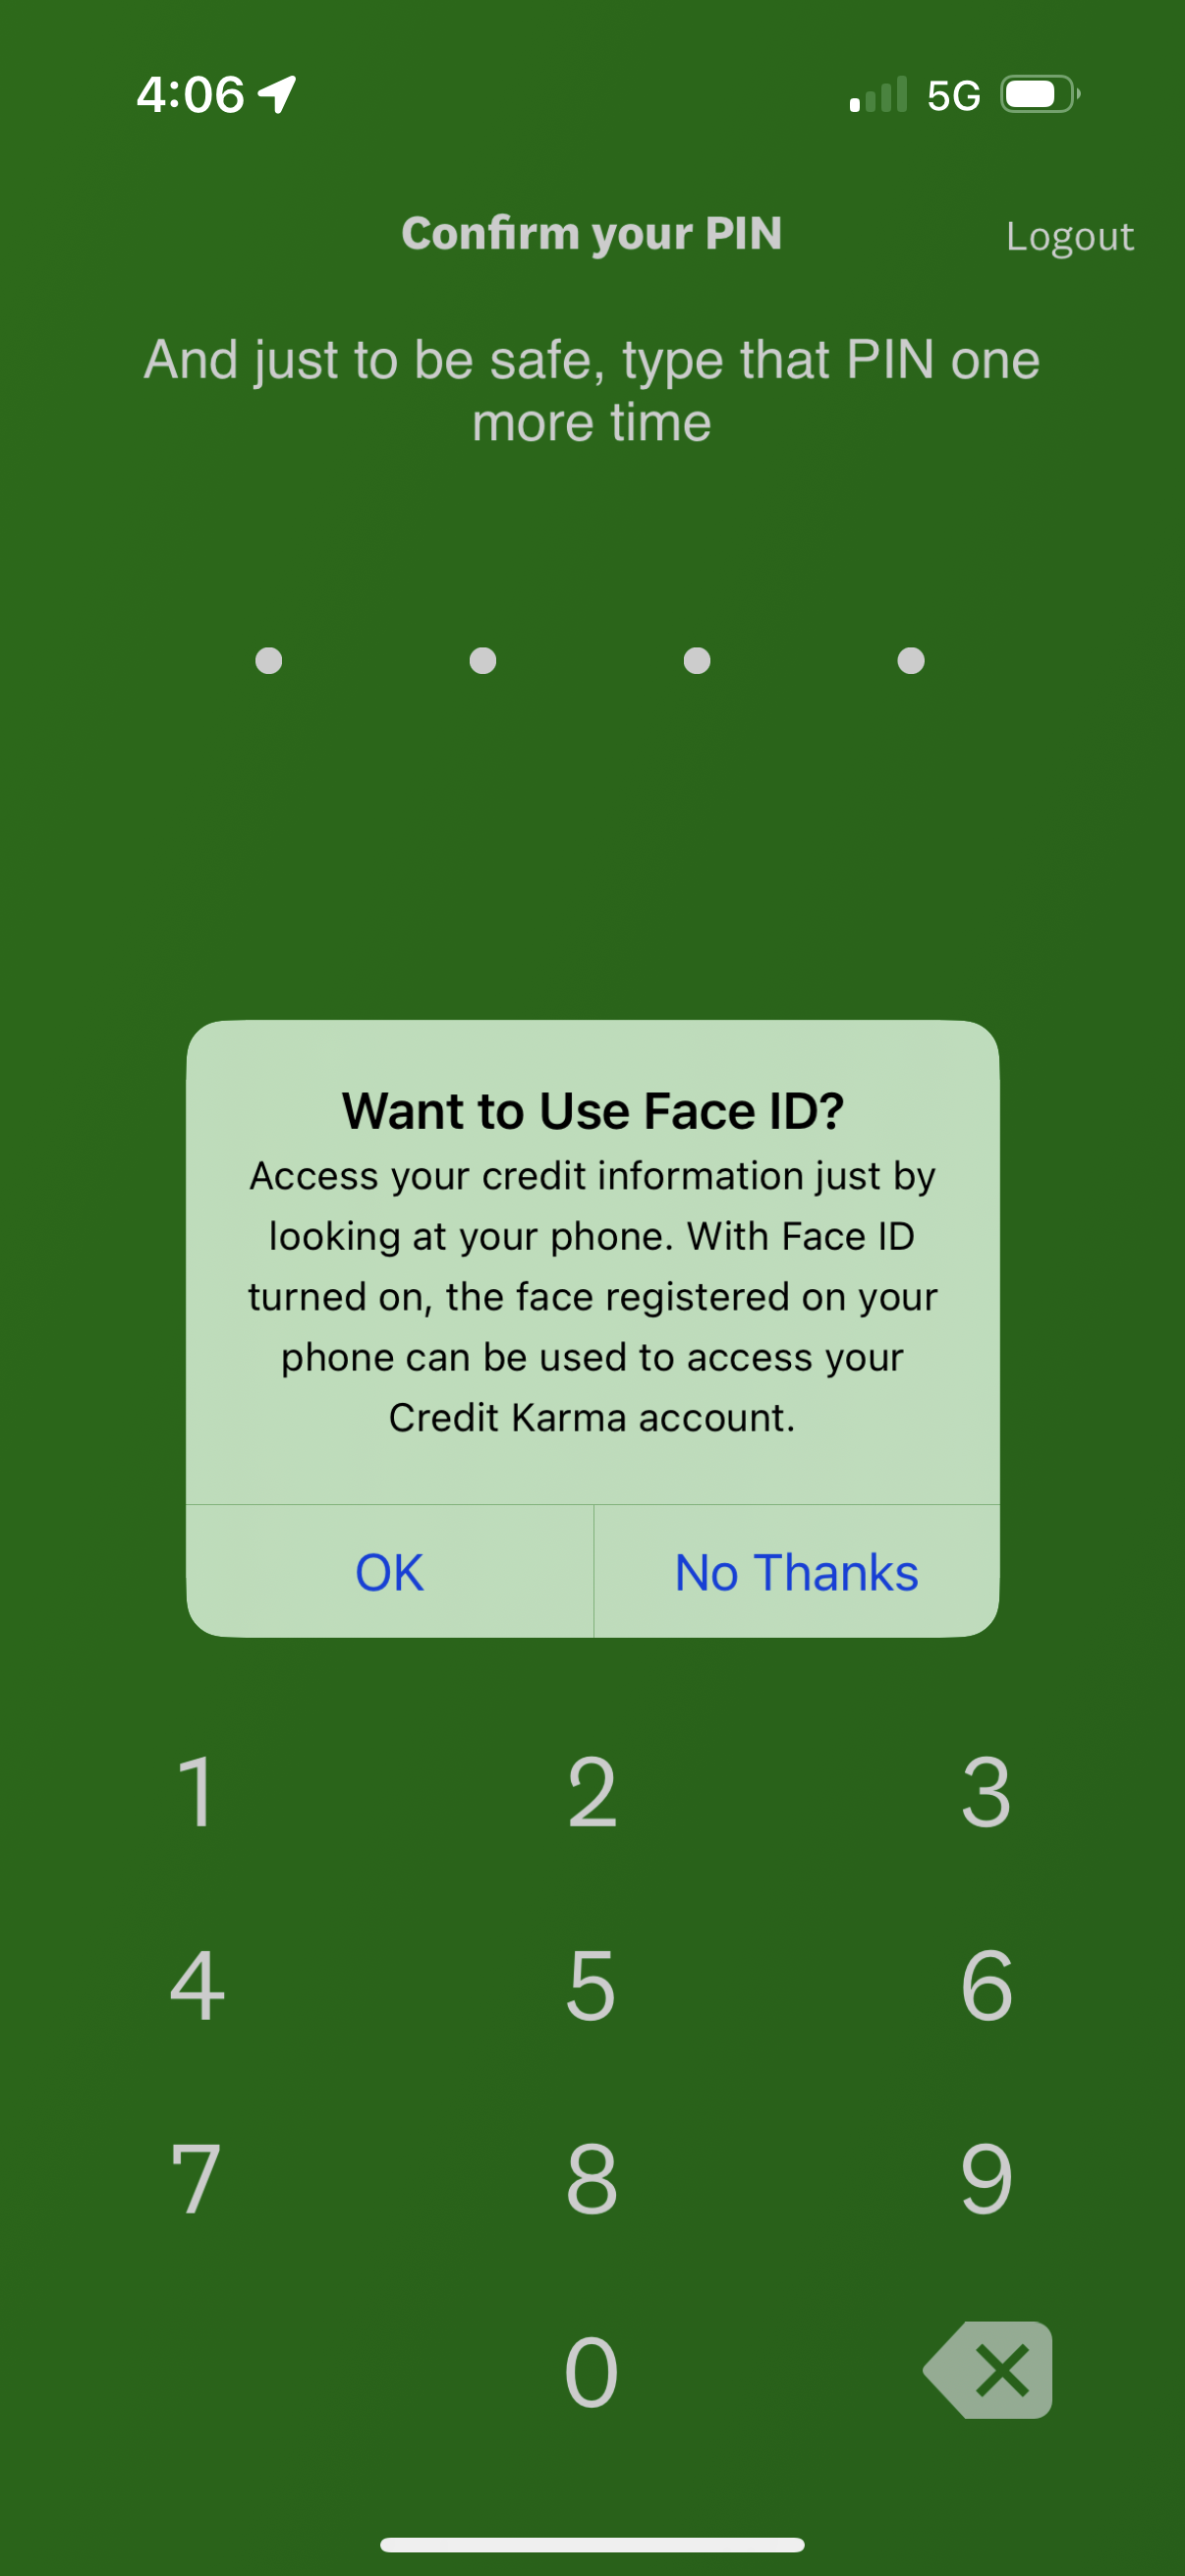
Credit Karma1206 × 2622opens the full image 
Hulu1125 × 2436opens the full image 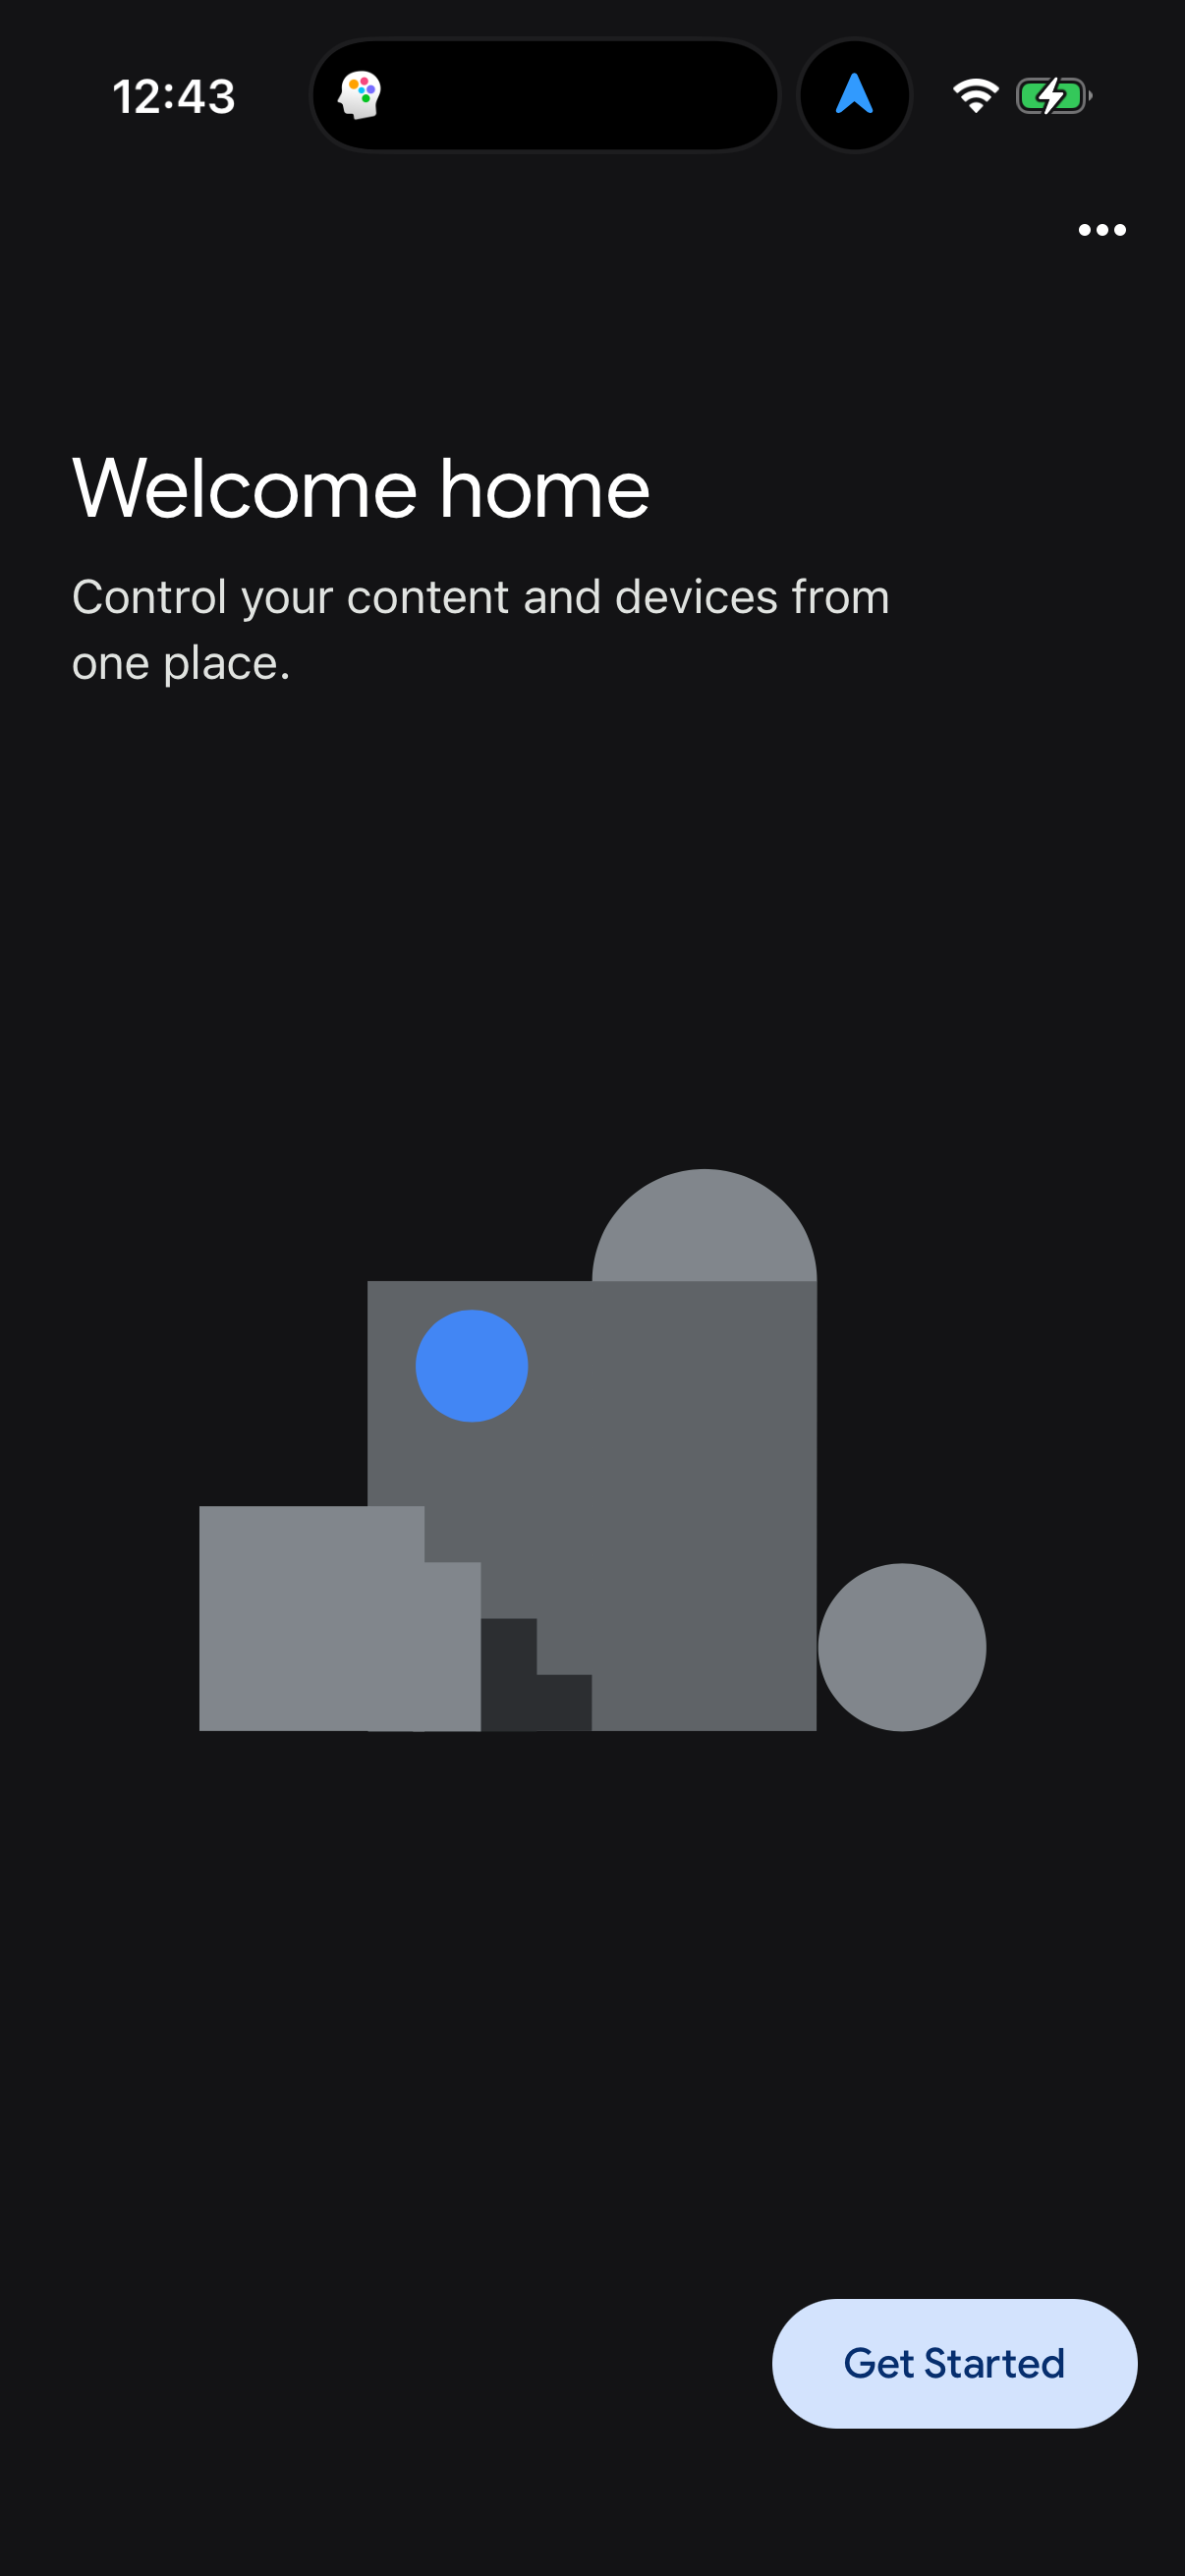
Google Home1206 × 2622opens the full image 
Apple News1206 × 2622opens the full image
The numbers
| # | Stat | Computed from |
|---|---|---|
| [1] | Hero 405 / offer 281 / pricing 229 / cta 225 / value props 178 / nav 135 / secondary actions 107 / announcement bar 62 / legal-trust 56 / social proof 48 | annotation_area_breakdown |
| [2] | 4,814 total detected experiments | total_detected_experiments |
| [3] | 307 hero-media experiments across 122 companies | tactic_mentions__hero_media_swaps |
| [4] | 18 hero-area experiments include social proof / trusted-by | hero_social_proof_experiments |
Methodology
Universe: 4,814 detected experiments (362 companies) in Lazyweb's ~800-app mobile corpus; area ranking from _experiment_annotations (distinct experiments per area, variants merged). Detected diffs with inferred rationale, not measured results. July 2026 pull.
Sources
- [1]
Lazyweb Research analysis of 4,814 detected experiments (362 companies, mobile-app corpus), July 2026
Annotated change-area breakdown (distinct experiments per area).
- [2]
Lazyweb Research analysis of 4,814 detected experiments (362 companies, mobile-app corpus), July 2026
Corpus of 4,814 detected before/after UI diffs; area labels merged (e.g. value props/features).
- [3]
Lazyweb Research analysis of 4,814 detected experiments (362 companies, mobile-app corpus), July 2026
307 hero-media experiments across 122 companies.
- [4]
Lazyweb Research analysis of 405 hero-area experiments (mobile-app corpus), July 2026
18 hero-area experiments also mention social proof / testimonial / trusted-by.
Source: Lazyweb Research — proprietary analysis of real, in-market app screens. Cite as Lazyweb Research, 2026-07-07.
Explore the evidence
- Full 45-frame August 2026 capture
- Three captured screens · August 2026