How do Health & Fitness apps frame free trials on their paywalls?
- By Ali Abouelatta
- n = 340
- Published
- Updated
- 3 min read
- paywall · trials · pricing · monetization · mobile · saas
Short answer
Health & Fitness paywalls are the most trial-led and least price-in-button of the big verticals: 38.5% of 340 primary CTAs mention a free trial, while only 3.8% put a price in the button source[1]source[2]. On length, 7-day dominates decisively — 25 mentions vs 8 for 30-day, 4 for 14-day, and just 2 for 3-day number[3]. This is a 'free week, price hidden above the button' category.
38.5% of 340 Health & Fitness primary CTAs are trial-led, but only 3.8% embed a price — July 2026.
2×2
How 630 paywalls combine offer framing × price-in-button
Most paywalls (70%) are direct with no price in the button; putting a price in the button is the exception in every quadrant. Source: Lazyweb Research, 630 paywalls.
← Direct (no trial)Trial-led →
- top-left: Trial-led · no price
- 108 (17%)
- top-right: Trial-led + price
- 20 (3%)
- bottom-left: Direct · no price
- 443 (70%)
- bottom-right: Direct + price
- 59 (9%)
← No price in buttonPrice in button →
Bar chart · Health & Fitness
Health & Fitness — The finding: trial-forward, price-shy, 7-day default
One block is about 1.4 Health & Fitness
- Trial-led primary CTAs
- 38.5% (131)
- Price inside the button
- 3.8% (13)
- 7-day mentions
- 25
- 30-day mentions
- 8
- 14-day mentions
- 4
- 3-day mentions
- 2
The finding: trial-forward, price-shy, 7-day default
Across 340 Health & Fitness primary CTAs (36 companies) source[1]:
The category runs well above baseline on trial-led framing and well below on price-in-button — the sharpest 'lead with free, keep price off the button' profile of the named verticals source[1]source[2].
Why 7-day and hidden price
Fitness and wellness value often takes a few sessions to land — a week is enough to build a habit signal, which is why 7-day is the runaway default (25 mentions, dwarfing 3-day's 2) number[3]. And at only 3.8% price-in-button, these apps almost never anchor on cost at the CTA; the price sits in the surrounding copy while the button stays soft ("Continue" / "Start") source[2]. The combination reduces sticker friction at the moment of tap.
How to apply this
For a health/fitness paywall, the on-norm pattern is: a 7-day free trial, a soft CTA verb, and the price placed above the button rather than inside it source[2]number[3]. If you're currently running a 3-day trial here, you're an outlier — only 2 mentions in the corpus — so treat it as a deliberate urgency bet, not the category default number[3]. Keeping the price out of the button matches 96% of the category and lowers tap-time friction, but pair it with a clear trial-then-price line so the auto-renewal isn't a surprise source[2]. Add 'cancel anytime' if lock-in fear is your main objection (see the reassurance pages).
Caveats
n=340 CTAs / 36 companies clears the n≥70 bar for the headline percentages; the per-length cells (25/8/4/2) are absolute counts and 30-day includes money-back copy number[3]number[6]. Category is a company-level join. Trial-led is a button-text keyword match; length reads CTA plus adjacent copy only; all figures use primary-role CTAs (39% unknown-role excluded) number[7].
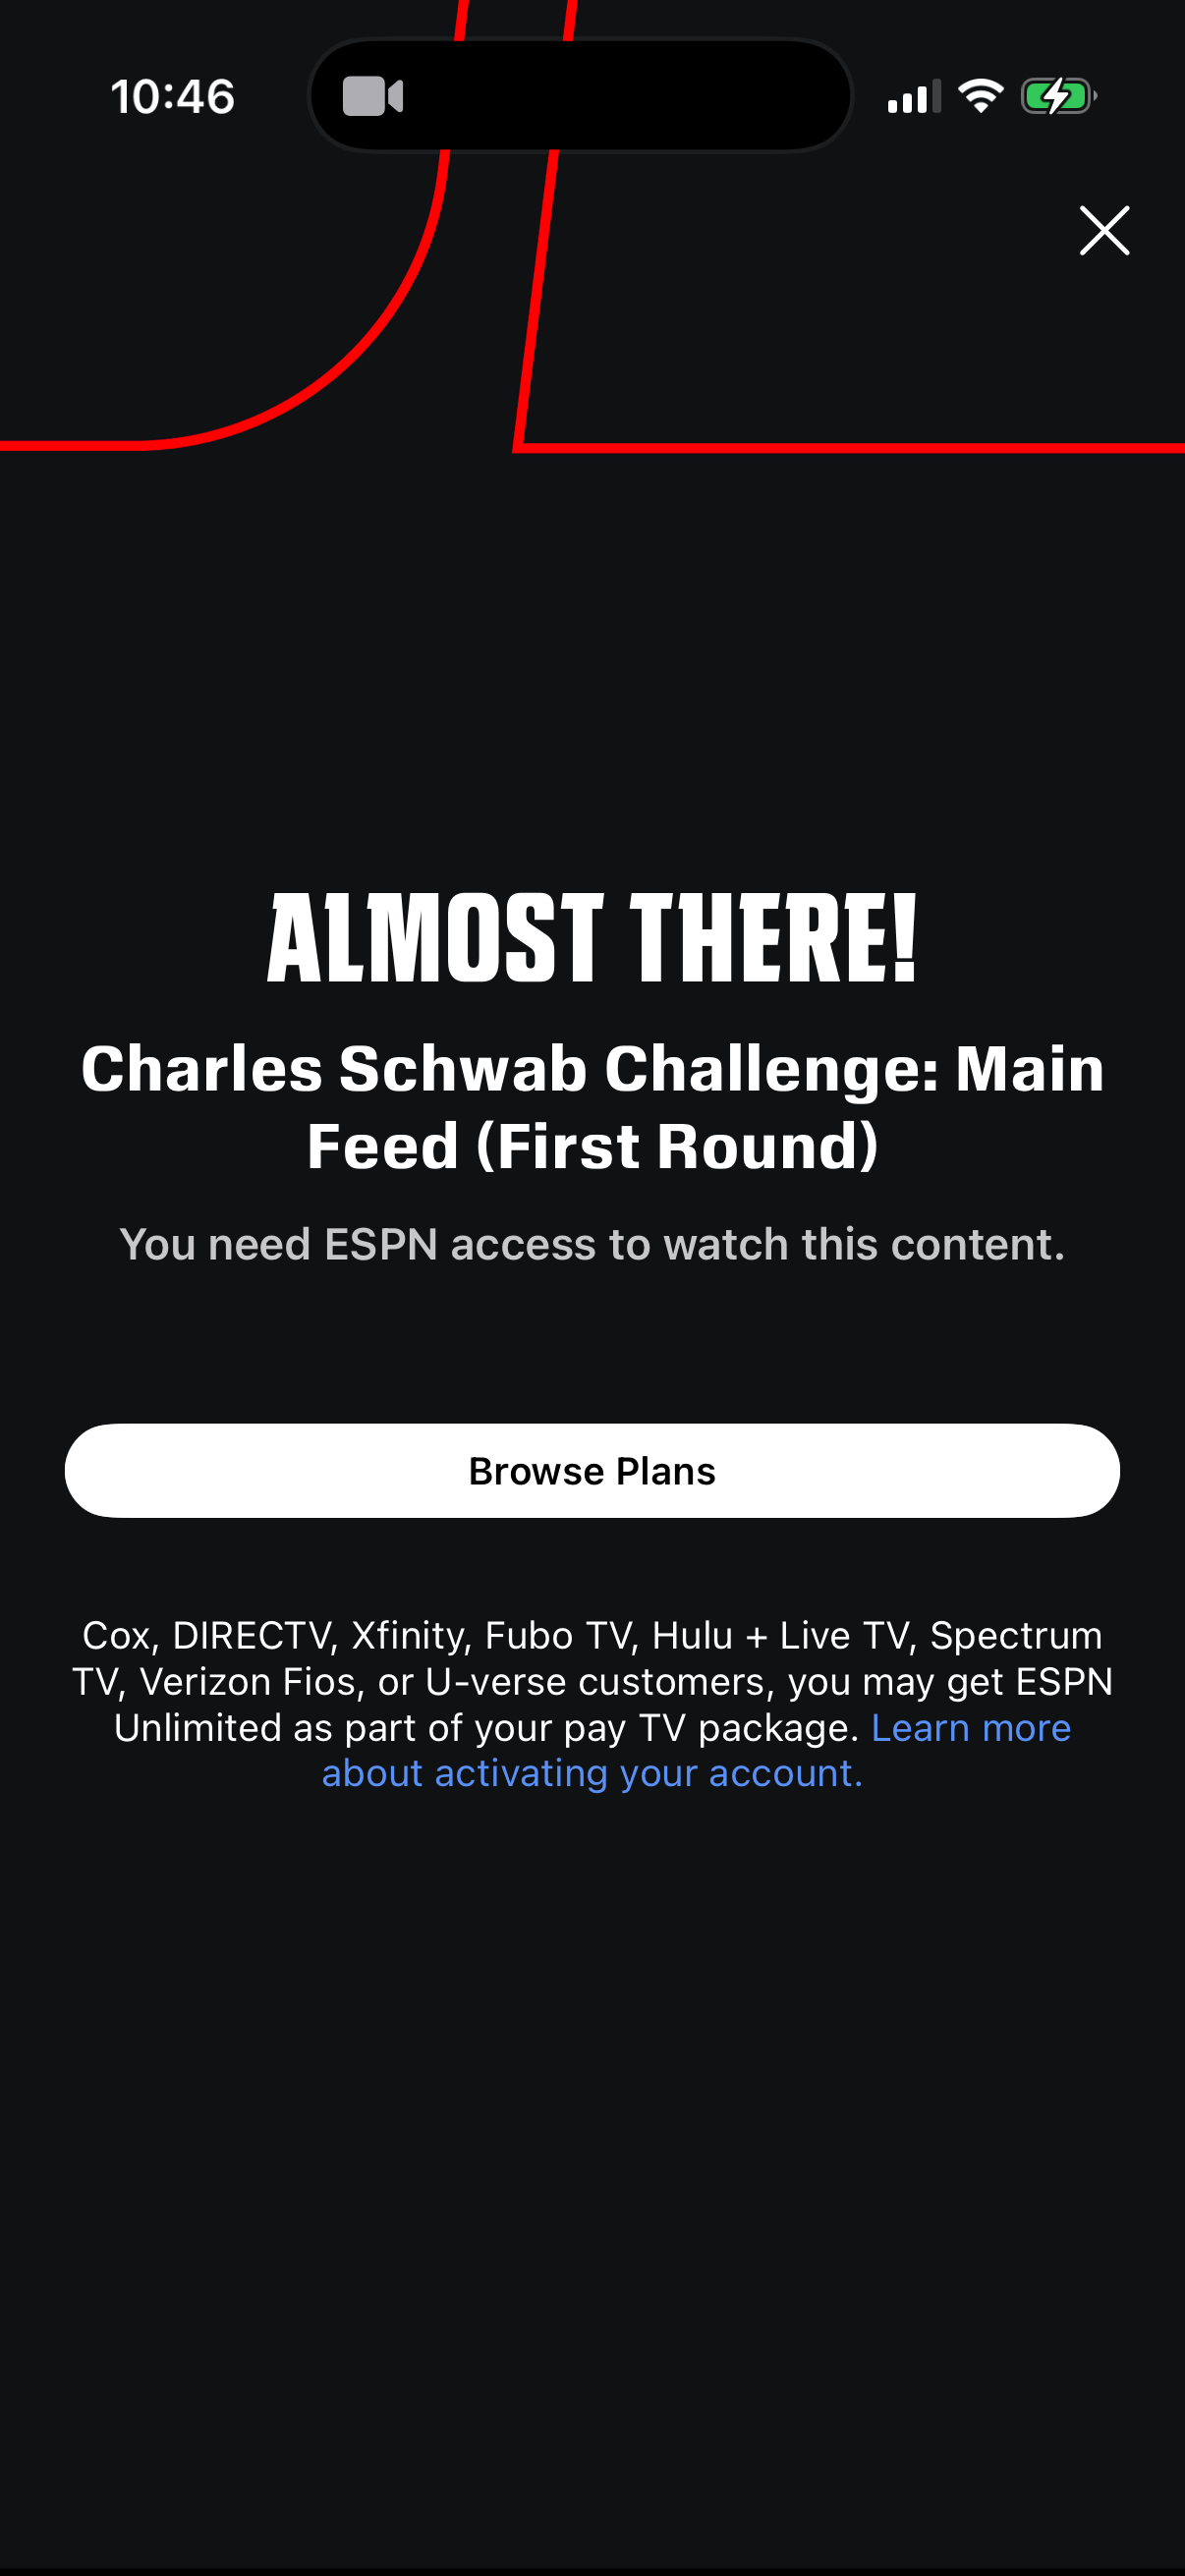
Real in-market screens
Screens from real, in-market apps, tracked by Lazyweb Research.
Espn1206 × 2622opens the full image 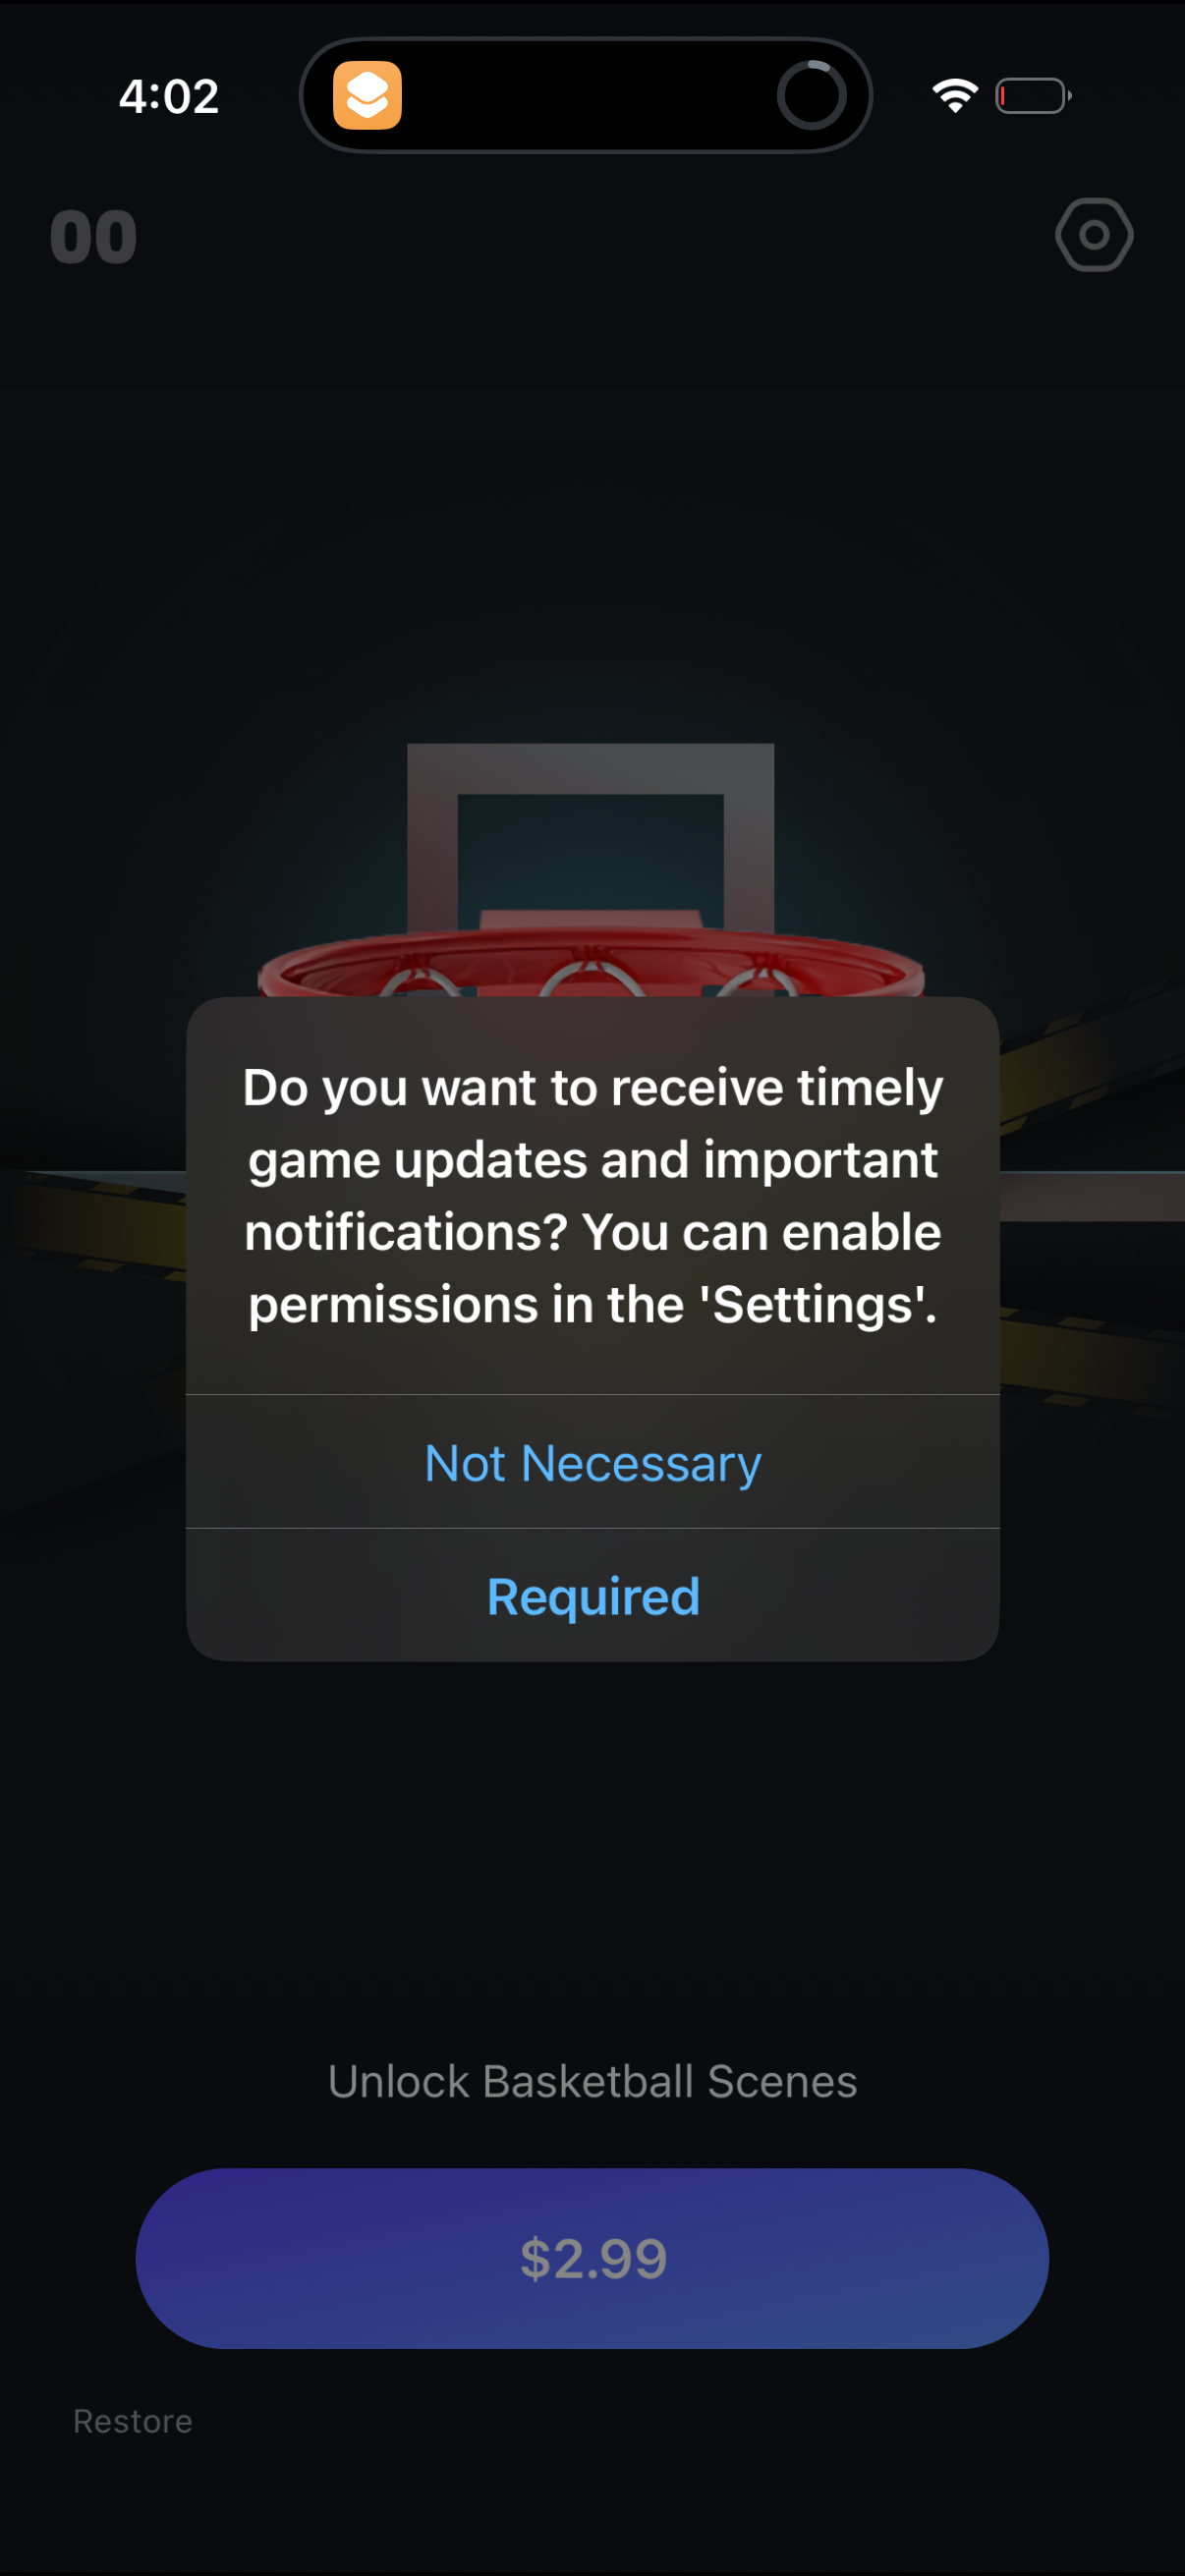
Airfun1206 × 2622opens the full image 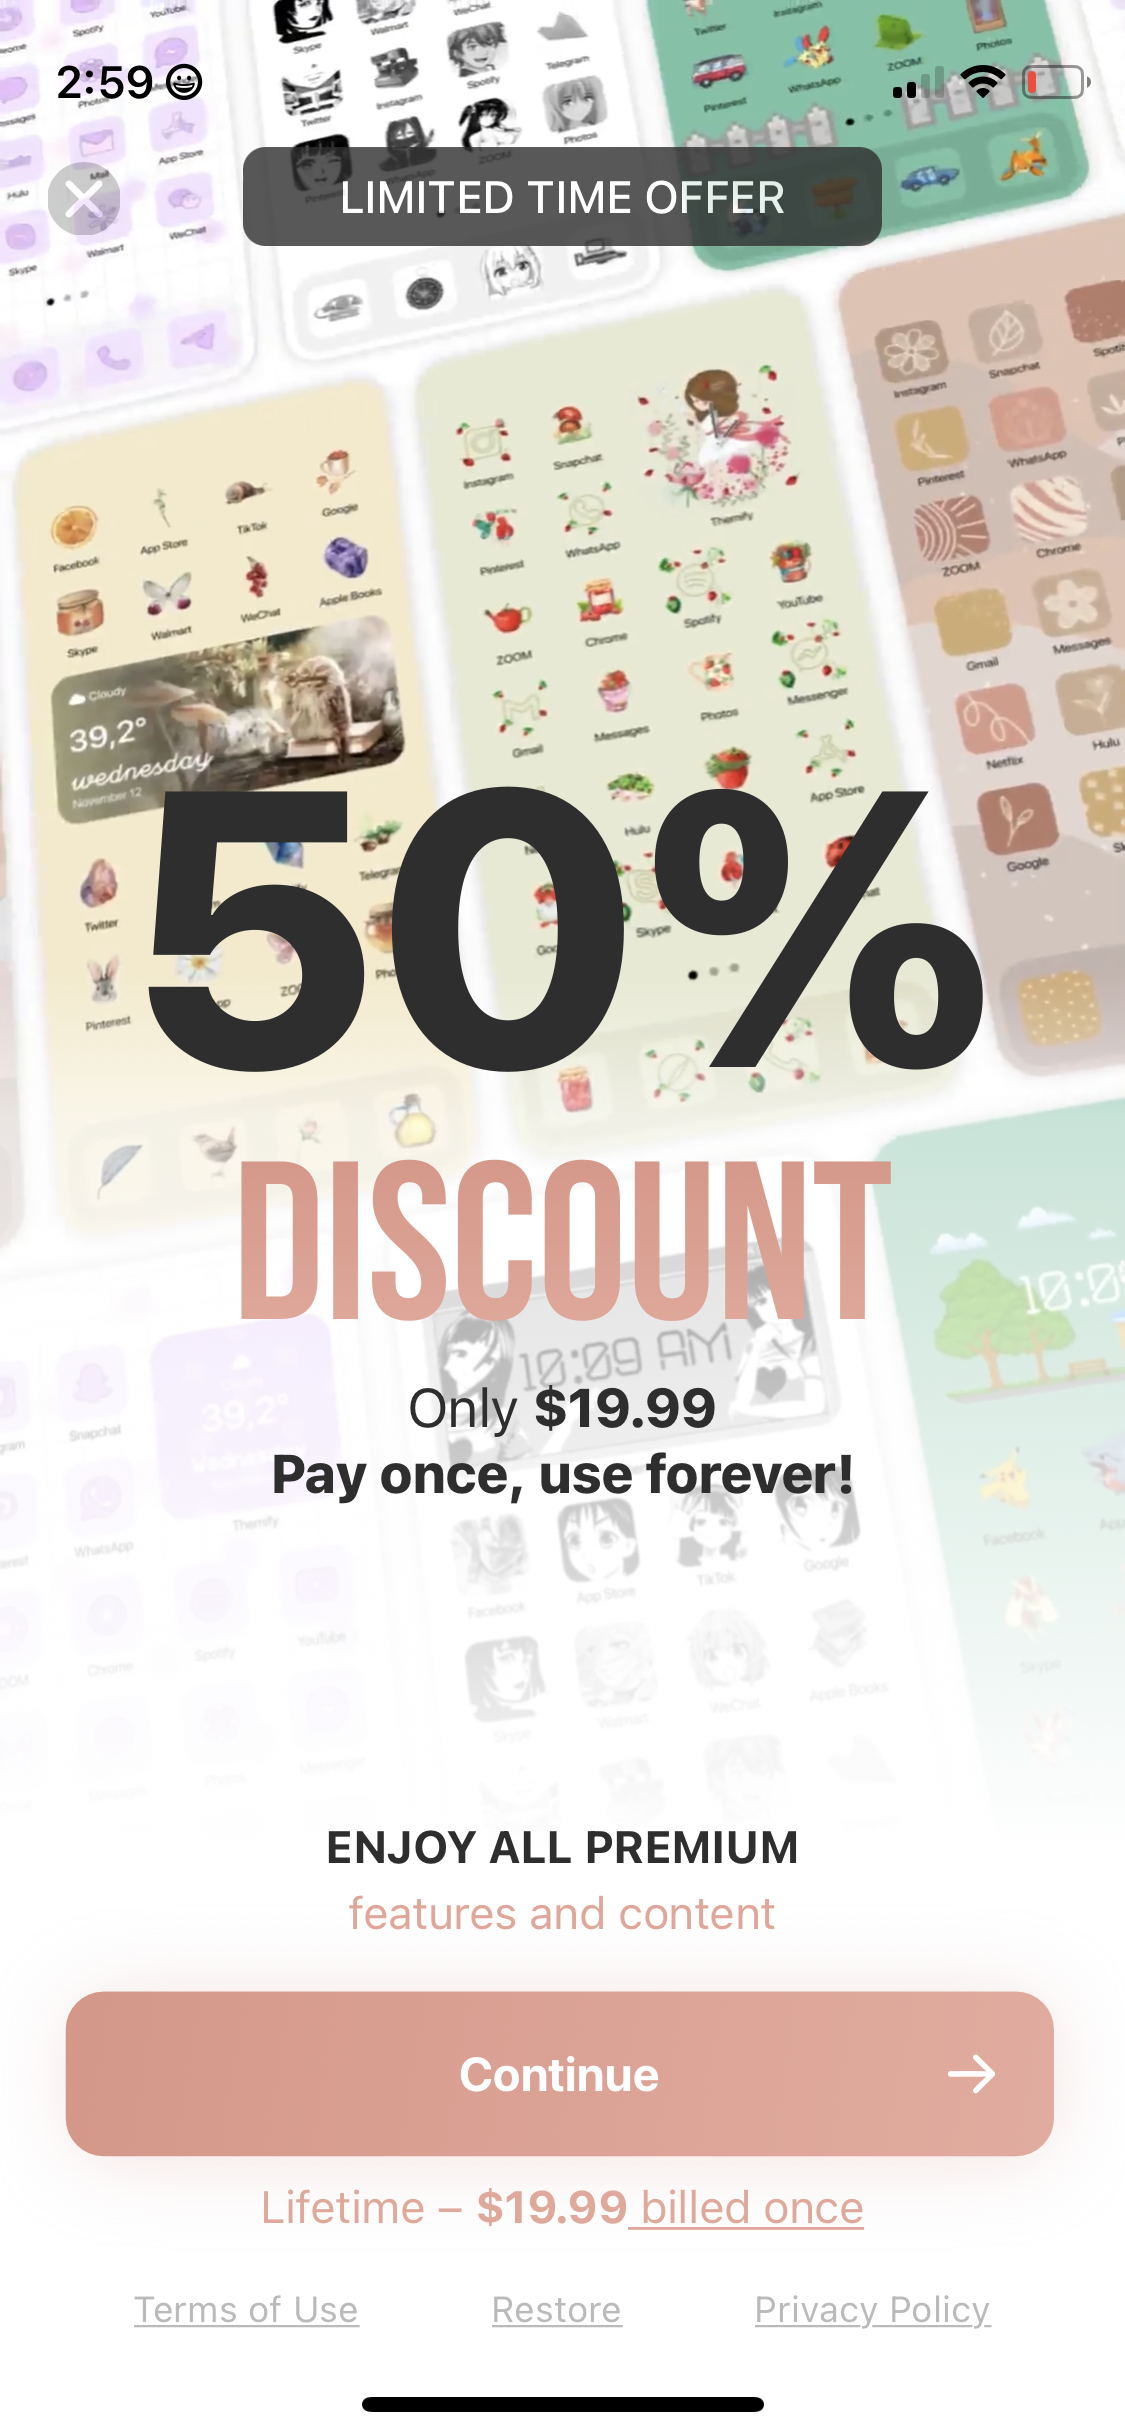
Themify1125 × 2436opens the full image 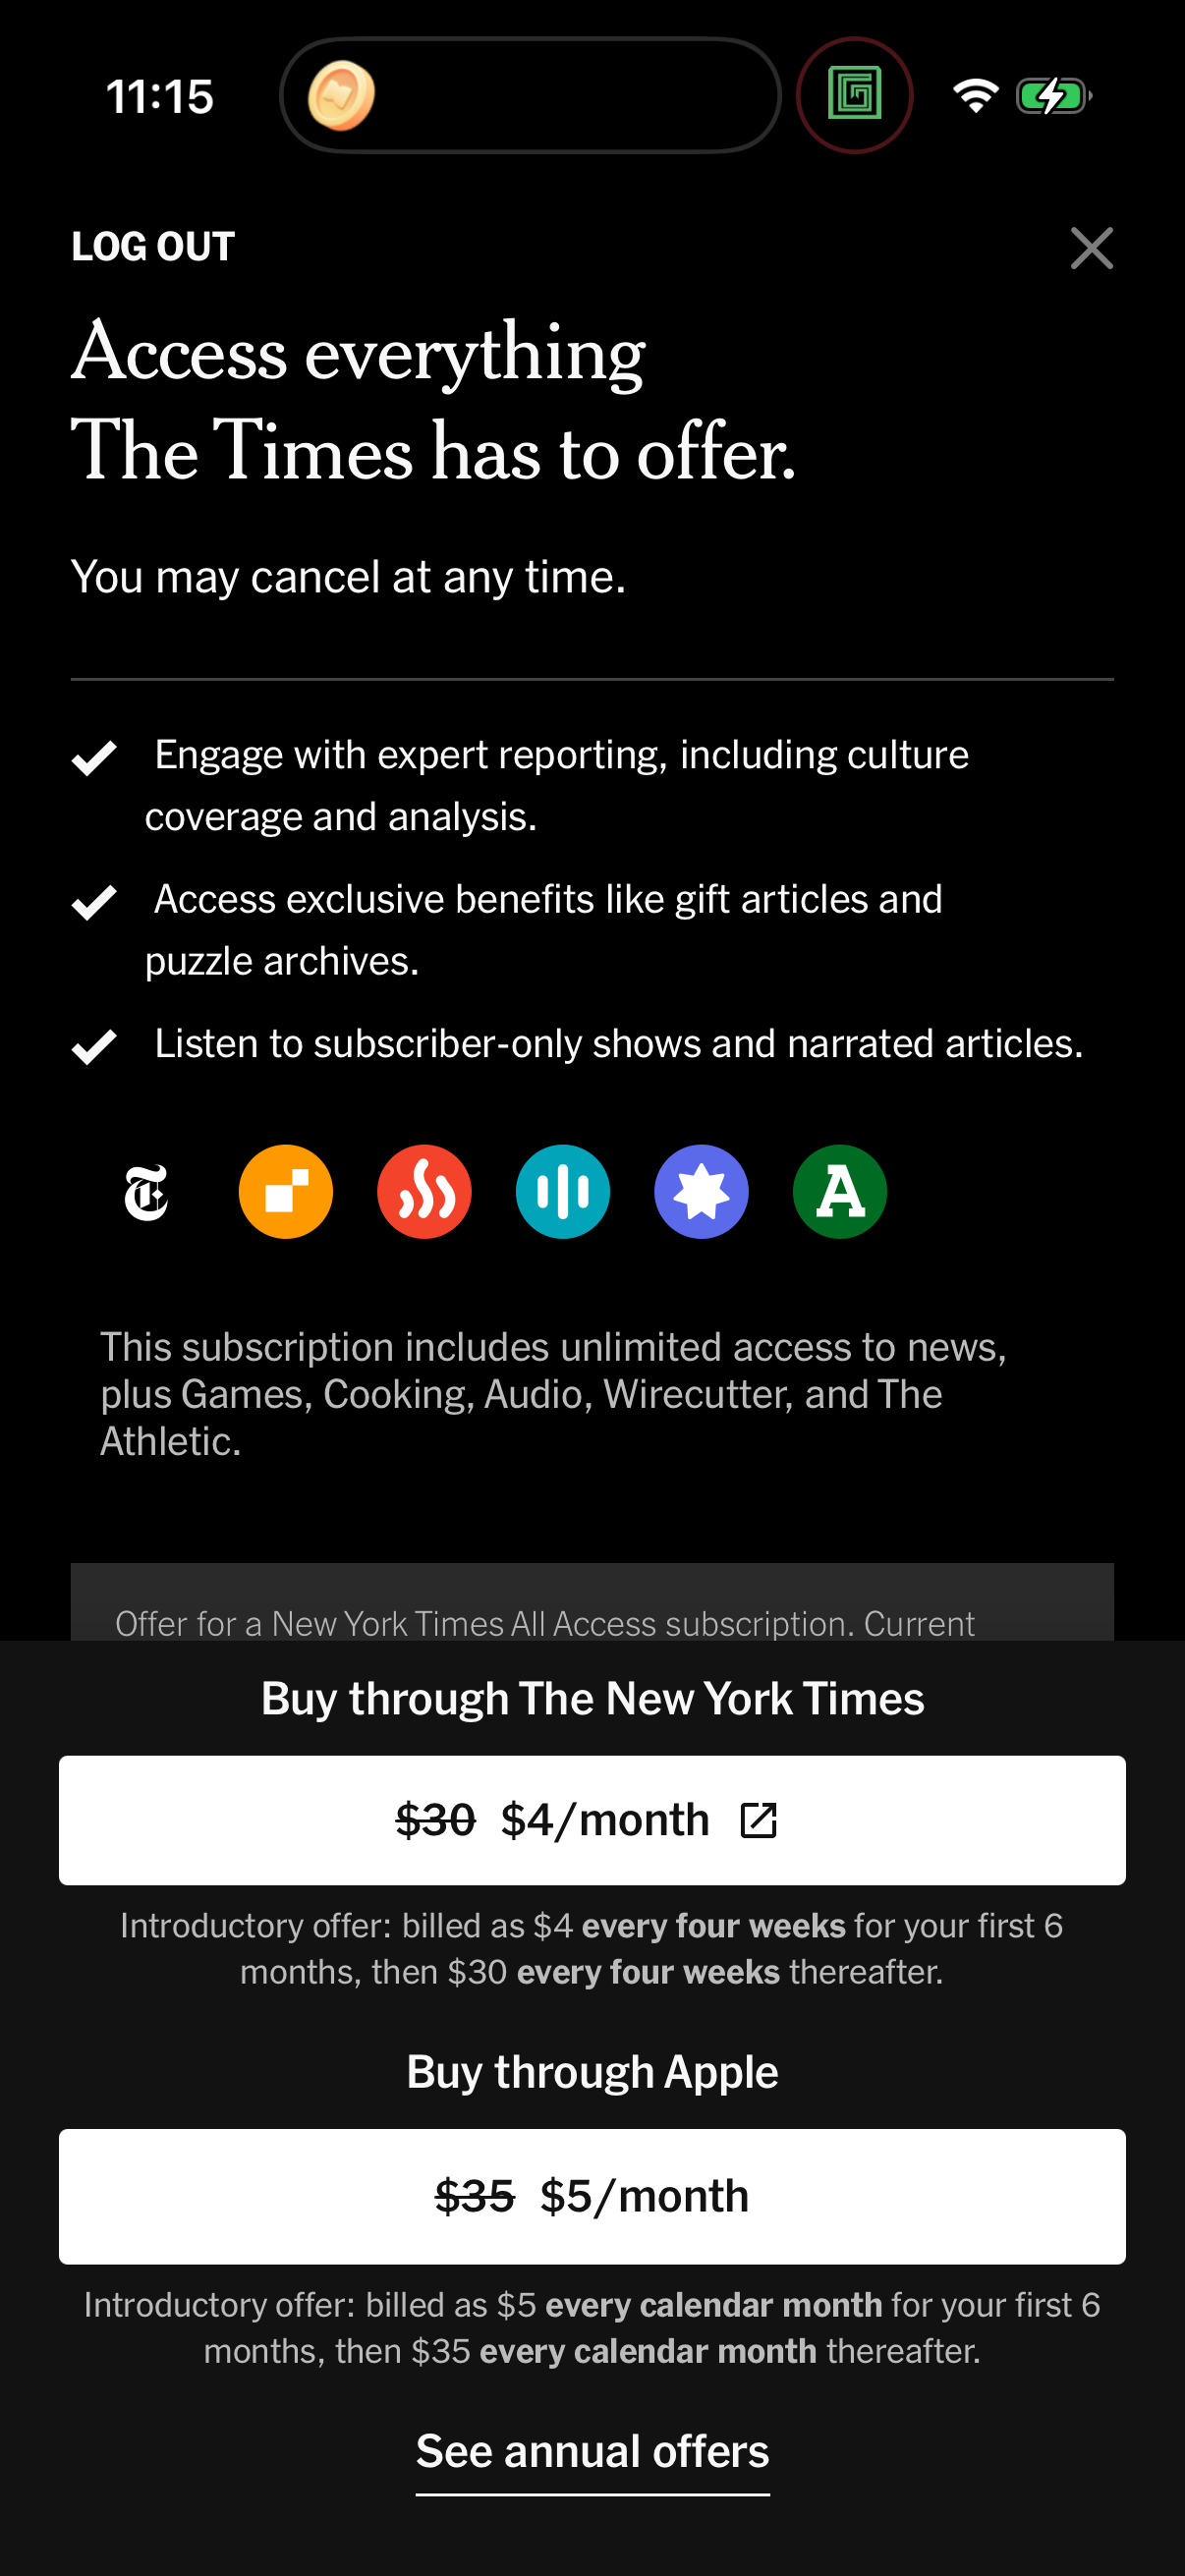
Nytimes1206 × 2622opens the full image
The numbers
| # | Stat | Computed from |
|---|---|---|
| [1] | Health & Fitness trial-led 38.5% (131/340), 36 companies | trial_led_by_category_health_fitness: 131/340, 36 companies |
| [2] | Health & Fitness price-in-CTA 3.8% (13/340) | trial_led_by_category_health_fitness price-in-CTA 13/340=3.8% |
| [3] | H&F lengths: 7-day 25, 30-day 8, 14-day 4, 3-day 2 | trial_led_by_category_health_fitness: 7-day 25, 3-day 2, 14-day 4, 30-day 8 |
| [4] | All-app trial-led baseline 33.7% | trial_led_primary_share: 33.7% |
| [5] | All-app price-in-CTA baseline 11.6% | price_in_cta_share: 11.6% |
| [6] | n=340 clears n>=70 per-vertical bar; 30-day includes money-back | methodologyNotes + smallSampleWarnings 30-day upper bound |
| [7] | 39% CTA rows role='unknown', excluded | universe note |
Methodology
Universe: 340 Health & Fitness primary CTAs / 36 companies (of 1,886 primary CTAs across ~800 tracked apps), July 2026. Category is a company-level join; per-length cells are absolute counts (30-day includes money-back copy).
Sources
- [1]
Lazyweb Research analysis of 340 Health & Fitness primary paywall CTAs (~800 tracked apps), July 2026
Category join on lower(company_name); trial-led keyword + per-length regex over CTA + adjacent copy.
- [2]
Lazyweb Research analysis of 1,886 primary paywall CTAs (~800 tracked apps), July 2026
All-app baselines for trial-led (33.7%) and price-in-CTA (11.6%).
Source: Lazyweb Research — proprietary analysis of real, in-market app screens. Cite as Lazyweb Research, 2026-07-07.