How Many Paywall CTAs Are Primary vs Secondary vs Dismiss?
- By Ali Abouelatta
- n = 2,679
- Published
- Updated
- 2 min read
- paywall · monetization · ux-patterns · design · mobile
Short answer
Of 4,406 paywall CTAs extracted from ~800 tracked apps, 2,679 are role-labeled: 1,886 primary (70%), 597 secondary (22%), and 196 dismiss (7%) source[1]. The remaining 1,727 (39% of the full corpus) are role-unknown and excluded from every role-based percentage source[2]. Primary buttons dominate, but nearly a quarter of labeled CTAs are secondary options like 'View all plans' and 'Restore'.
Of 2,679 role-labeled paywall CTAs, 70% are primary, 22% secondary, and 7% dismiss — Lazyweb Research, 4,406-CTA corpus, July 2026.
Bar chart · CTAs
CTAs — Role breakdown
One block is about 21.3 CTAs
- Primary
- 1,886
- Secondary
- 597
- Dismiss
- 196
- (Unknown, excluded)
- 1,727
The finding
Lazyweb Research role-labeled 2,679 of the 4,406 paywall CTAs: 1,886 primary, 597 secondary, 196 dismiss source[1]. As shares of the labeled set, that's roughly 70% / 22% / 7%. The primary button is the star, but paywalls carry a meaningful supporting cast — plan-switchers, restore links, and an escape hatch.
Role breakdown
| Role | CTAs | Share of labeled (2,679) |
|---|---|---|
| Primary | 1,886 | 70% |
| Secondary | 597 | 22% |
| Dismiss | 196 | 7% |
| (Unknown, excluded) | 1,727 | — |
The 1,727 role-unknown rows are 39% of the full 4,406 corpus and are left out of every role percentage in this research — which is why all role-based denominators here are 2,679 or 1,886, never 4,406 source[2].
How to apply it
Use this as a layout checklist. Most paywalls in the corpus pair one primary button with at least one secondary option (view/compare plans, restore) and often a dismiss link. If your paywall is primary-only, you're leaner than the norm; if you're stacking many secondary CTAs, be sure they aren't stealing taps from the primary. The 7% dismiss share confirms an explicit opt-out ('Not now', 'Maybe later') is standard, not a leak.
Caveats
Roles were labeled on 61% of the corpus; the 39% unknown could shift shares if labeled, so read 70/22/7 as 'of labeled CTAs'. Counts are per extracted CTA instance, so heavily-screenshotted apps contribute more rows — company-level analyses elsewhere in this research correct for that source[1].
Real in-market screens
Screens from real, in-market apps, tracked by Lazyweb Research.

Meitu1206 × 2622opens the full image 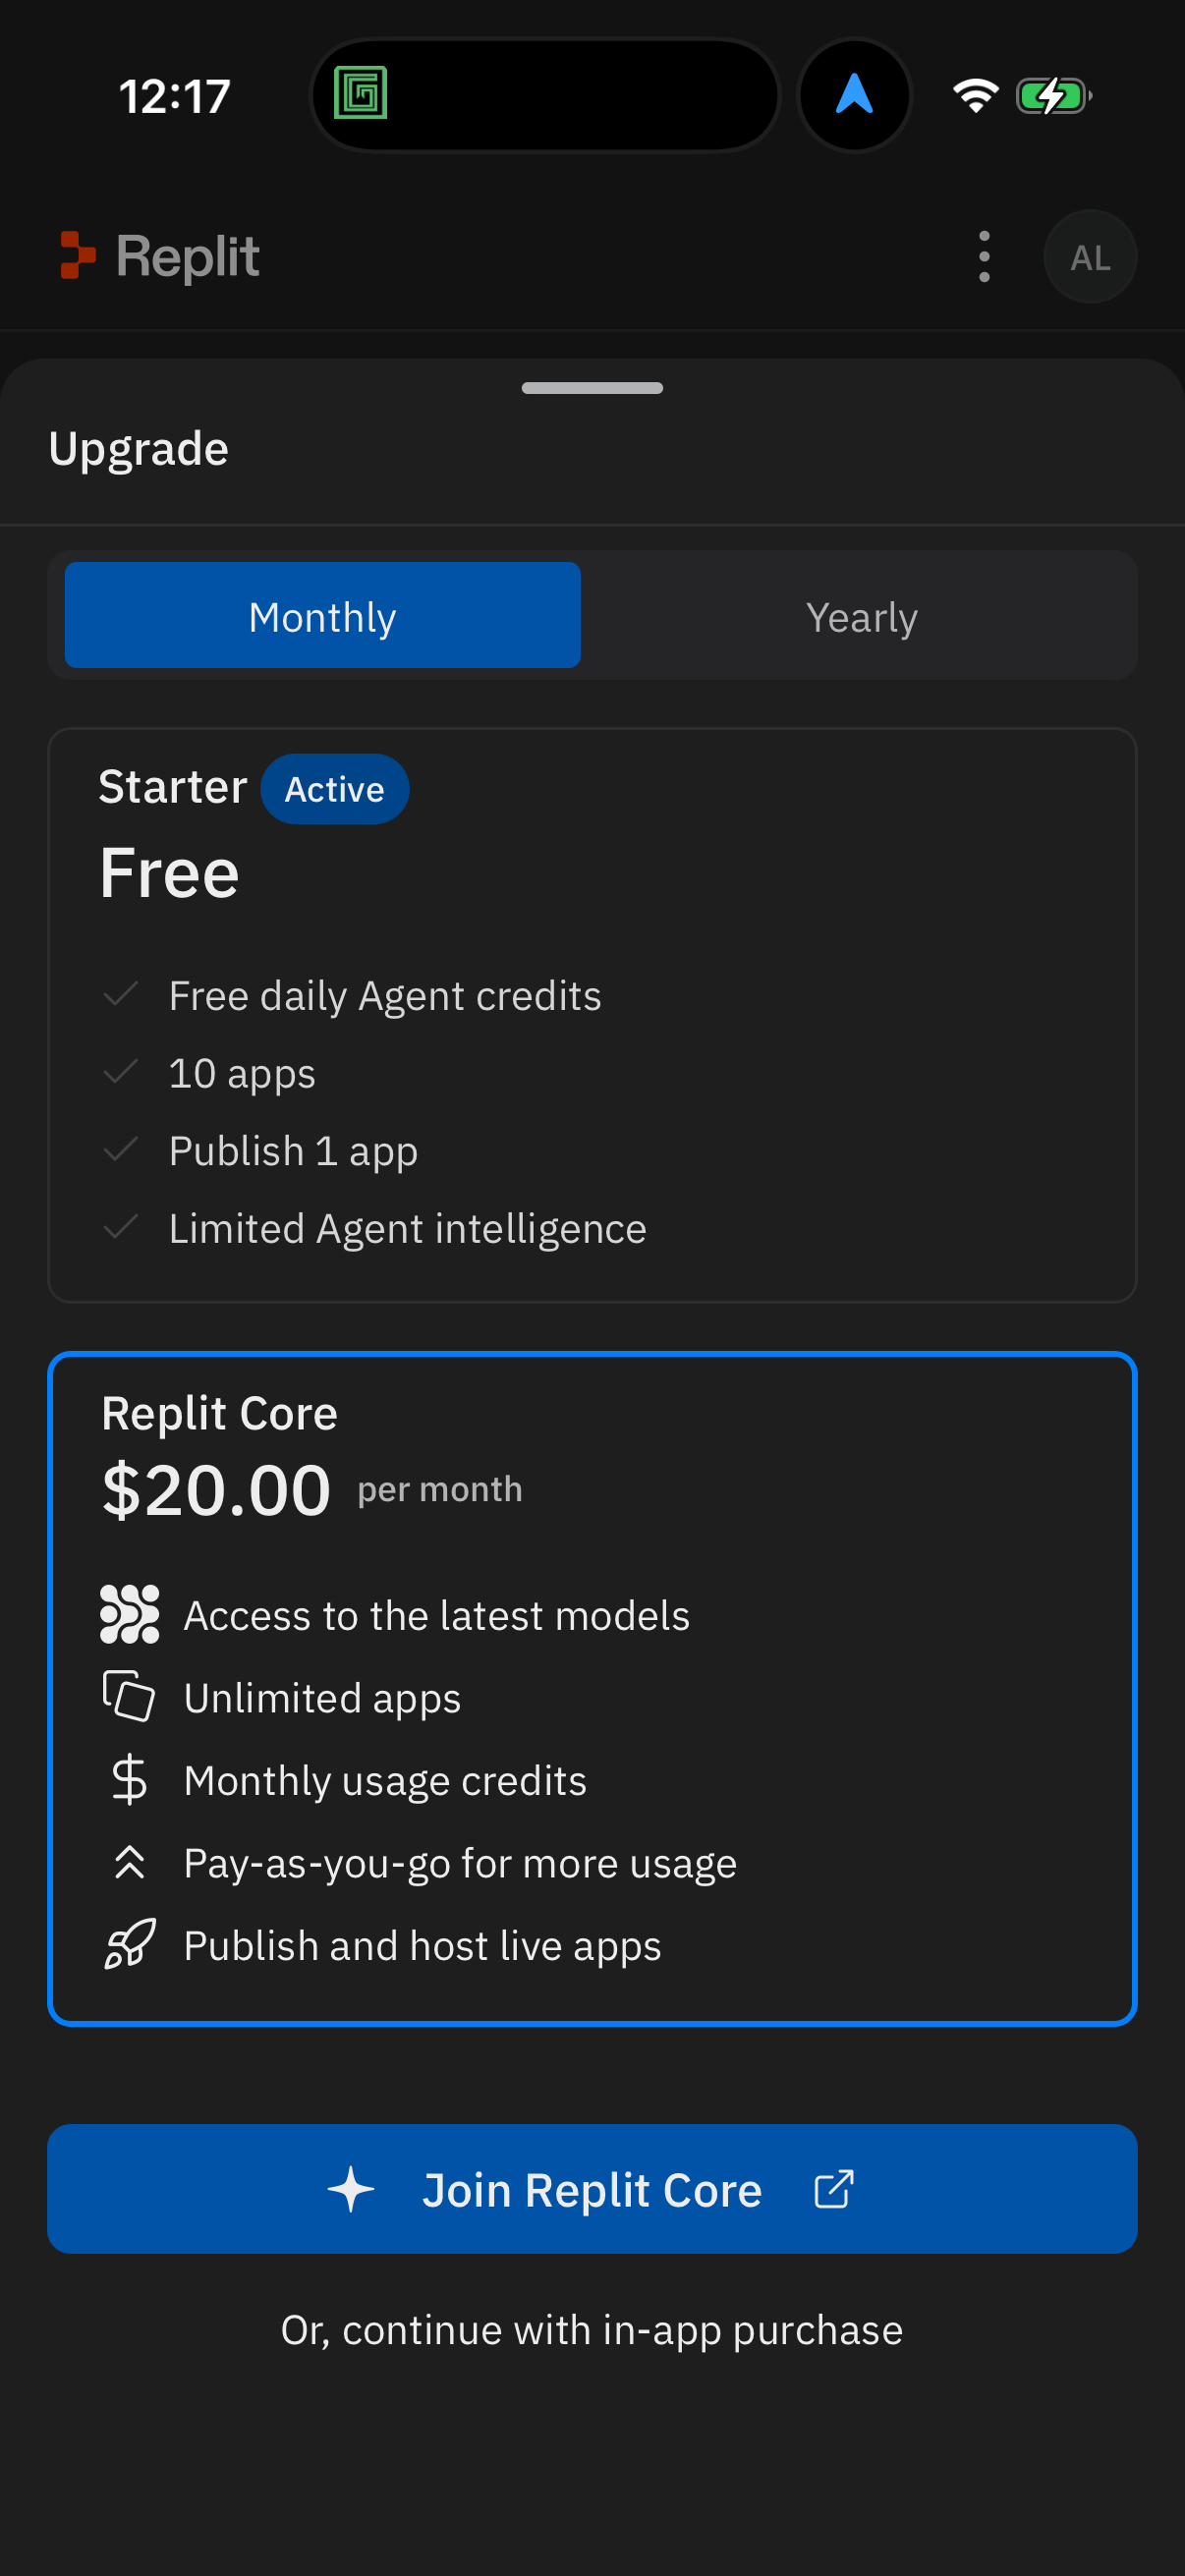
Replit1206 × 2622opens the full image 
Ladder1206 × 2622opens the full image 
Wsj1206 × 2622opens the full image
The numbers
| # | Stat | Computed from |
|---|---|---|
| [1] | primary 1886, secondary 597, dismiss 196; labeled total 2679 | statpack role_distribution |
| [2] | unknown 1727 of 4406 (39%) | statpack role_distribution |
Methodology
Universe: 4,406 paywall CTAs extracted from ~800 tracked mobile apps, July 2026; 2,679 role-labeled. Shares computed on labeled rows. Caveat: 39% of CTAs are role-unknown and excluded from role percentages.
Sources
- [1]
Lazyweb Research analysis of 4,406 paywall CTAs (from ~800 tracked mobile apps), July 2026
cta_role grouped and counted; 2,679 labeled (primary/secondary/dismiss), 1,727 unknown.
- [2]
Lazyweb Research analysis of 2,679 role-labeled paywall CTAs (from ~800 tracked mobile apps), July 2026
Role shares computed on labeled rows only.
Source: Lazyweb Research — proprietary analysis of real, in-market app screens. Cite as Lazyweb Research, 2026-07-07.